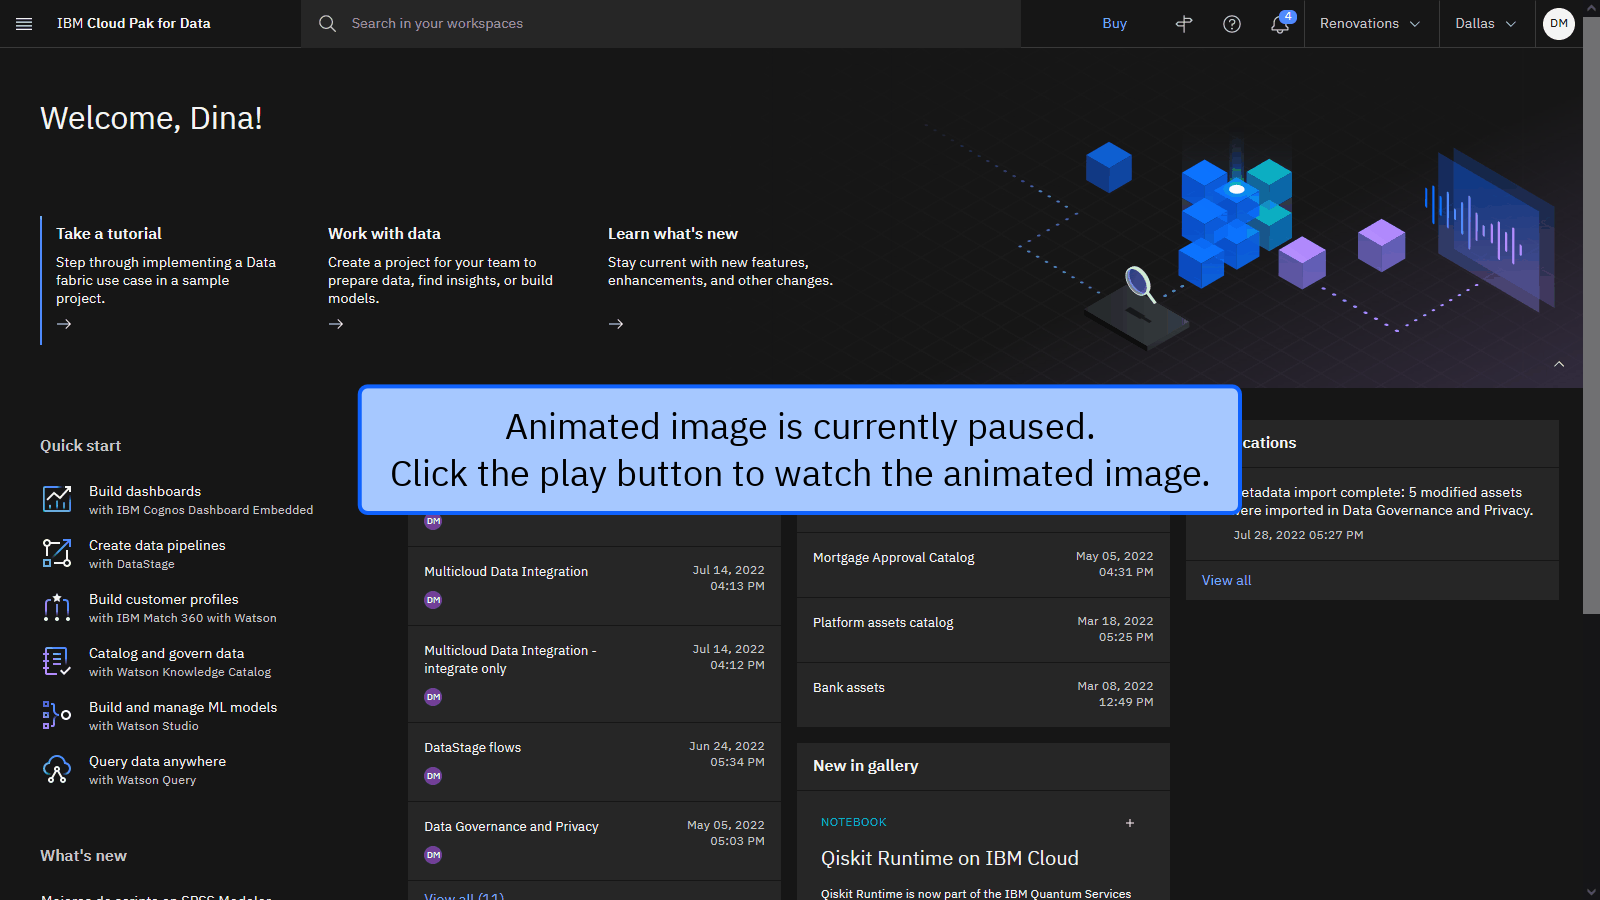
Take this tutorial to transform data stored in three external data sources with the Data integration use case of the data fabric trial. Your goal is to use DataStage to transform the data, and then deliver that transformed data to a single output file. If you completed the Virtualize external data tutorial, then you did many of the same tasks using Data Virtualization that this tutorial accomplishes using DataStage.
The story for the tutorial is that Golden Bank needs to adhere to a new regulation where it cannot lend to underqualified loan applicants. As a data engineer at Golden Bank, you currently use DataStage to aggregate your anonymized mortgage applications data with the mortgage applicants’ personally identifiable information. Your lenders use this information to help them decide whether they should approve or deny mortgage applications. Your leadership added some risk analysts who calculate daily what interest rate they recommend offering to borrowers in each credit score range. You need to integrate this information into the spreadsheet you share with the lenders. The spreadsheet includes credit score information for each applicant, the applicant’s total debt, and an interest-rate lookup table. Lastly, load your data into a target output CSV file.
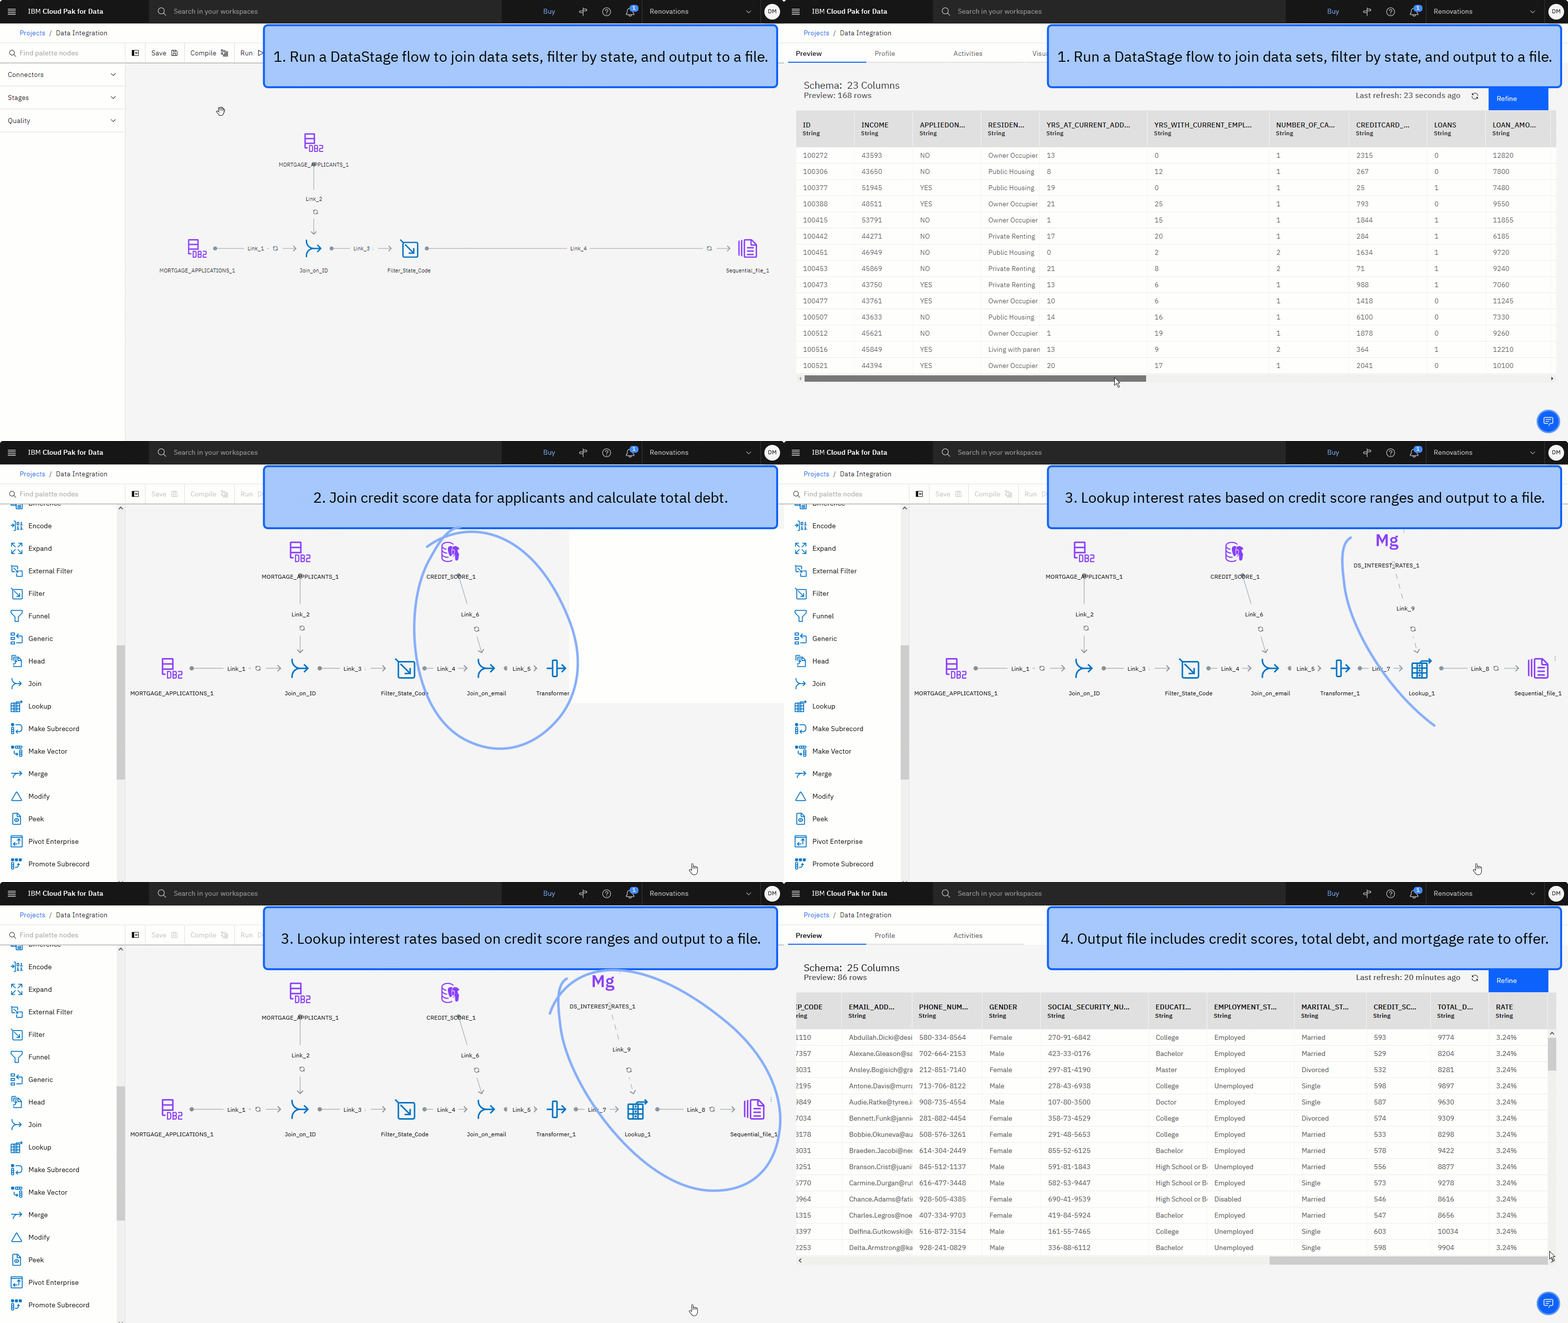
The following animated image provides a quick preview of what you’ll accomplish by the end of this tutorial. You will use DataStage to join applicant and application data, filter by state, join applicant credit scores, calculate total debt, look up the mortgage interest rate to offer based on credit score ranges, and output the result to a CSV file. Click the image to view a larger image.
Preview the tutorial
In this tutorial, you will complete these tasks:
- Set up the prerequisites.
- Task 1: Run an existing DataStage flow
- Edit the DataStage flow to:
- Task 2: Specify a key column for the Join stage
- Task 3: Add credit score data from a PostgreSQL database
- Task 4: Add a Join stage to join the credit score data with the applicant and application data
- Task 5: Add a Transformer stage to calculate total debt
- Task 6: Add interest rate data from a MongoDB database
- Task 7: Add a Lookup stage to look up interest rates for applicants
- Task 8: Edit the Sequential file node and run the DataStage flow
- Task 9: Create a catalog to store the published data asset
- Task 10: View the output and publish to a catalog
- Cleanup (Optional)
 Watch this video to preview the steps in this tutorial. There might be slight differences in the user interface shown in the video. The
video is intended to be a companion to the written tutorial.
This video provides a visual method to learn the concepts and tasks in this documentation.
Tips for completing this tutorial
Here are some tips for successfully completing this tutorial.
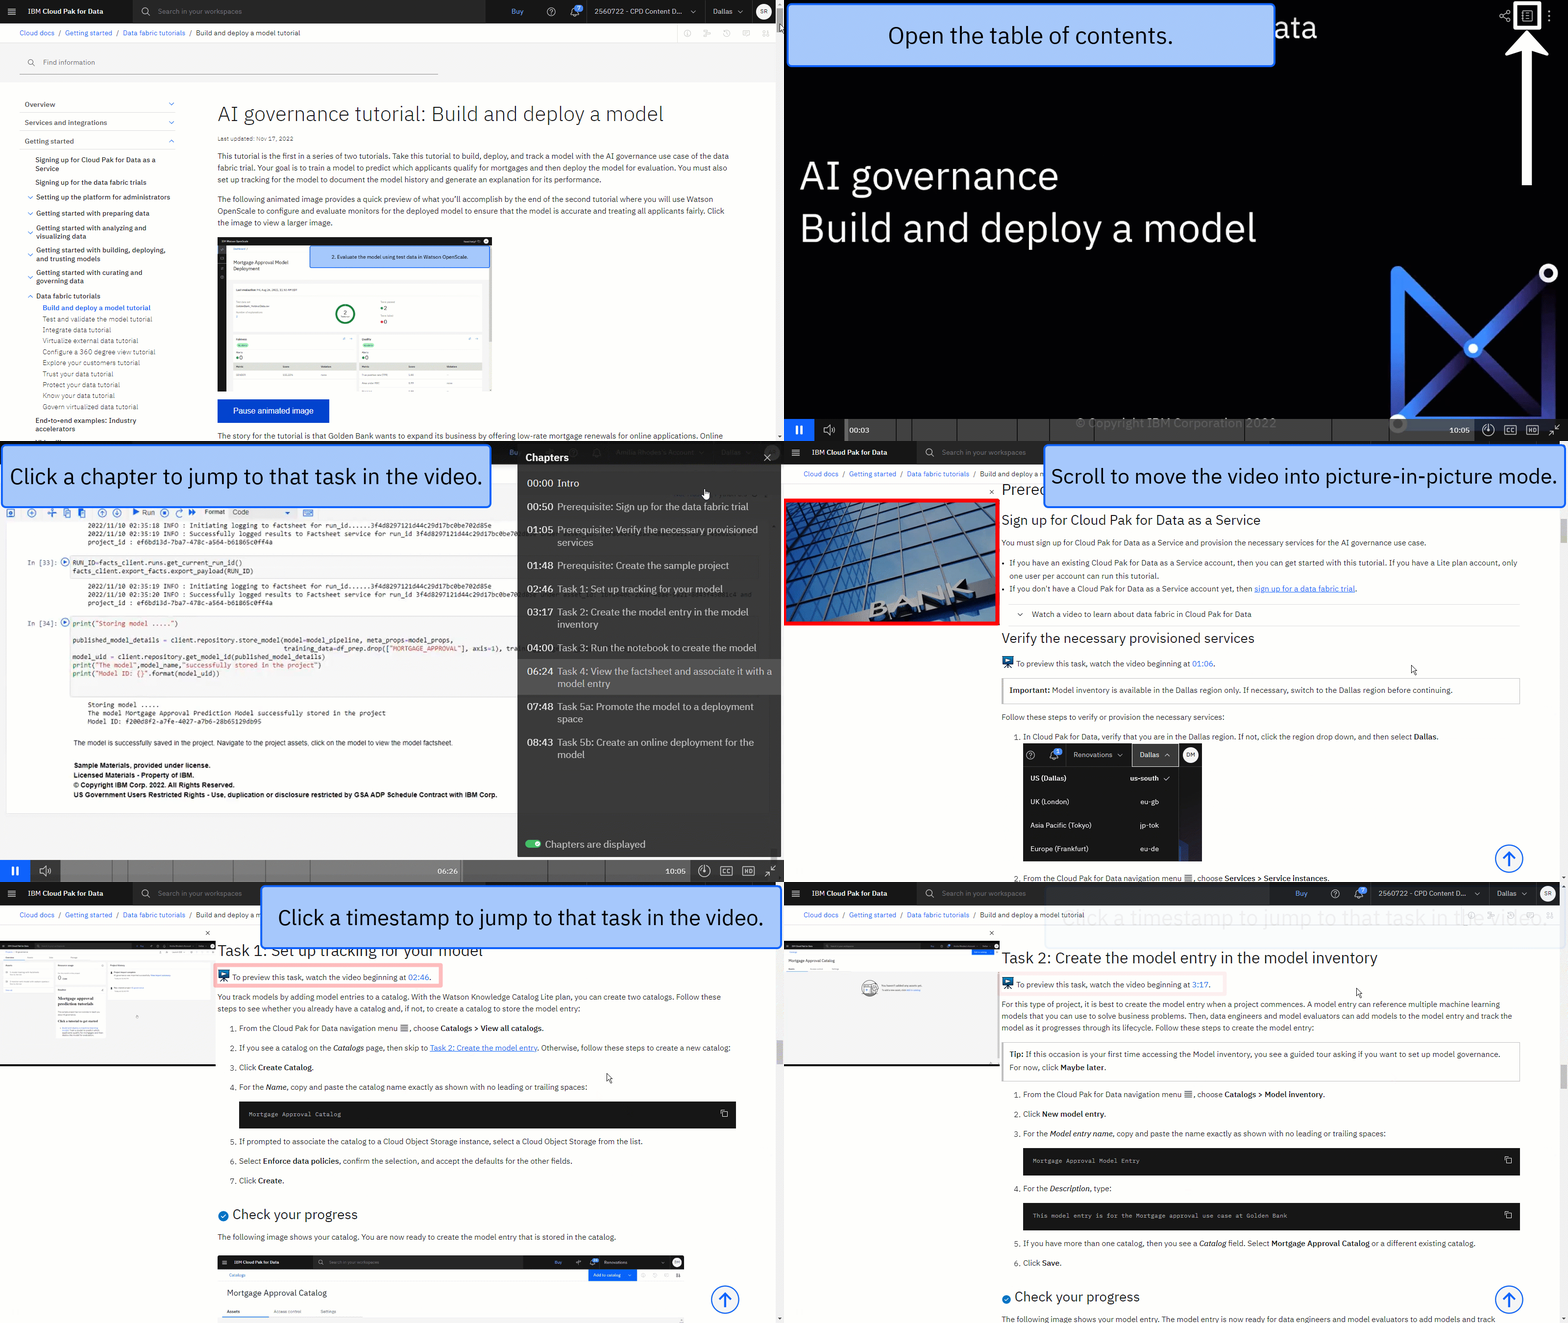
Use the video picture-in-picture
The following animated image shows how to use the video picture-in-picture and table of contents features:
Get help in the community
If you need help with this tutorial, you can ask a question or find an answer in the Cloud Pak for Data Community discussion forum.
Set up your browser windows
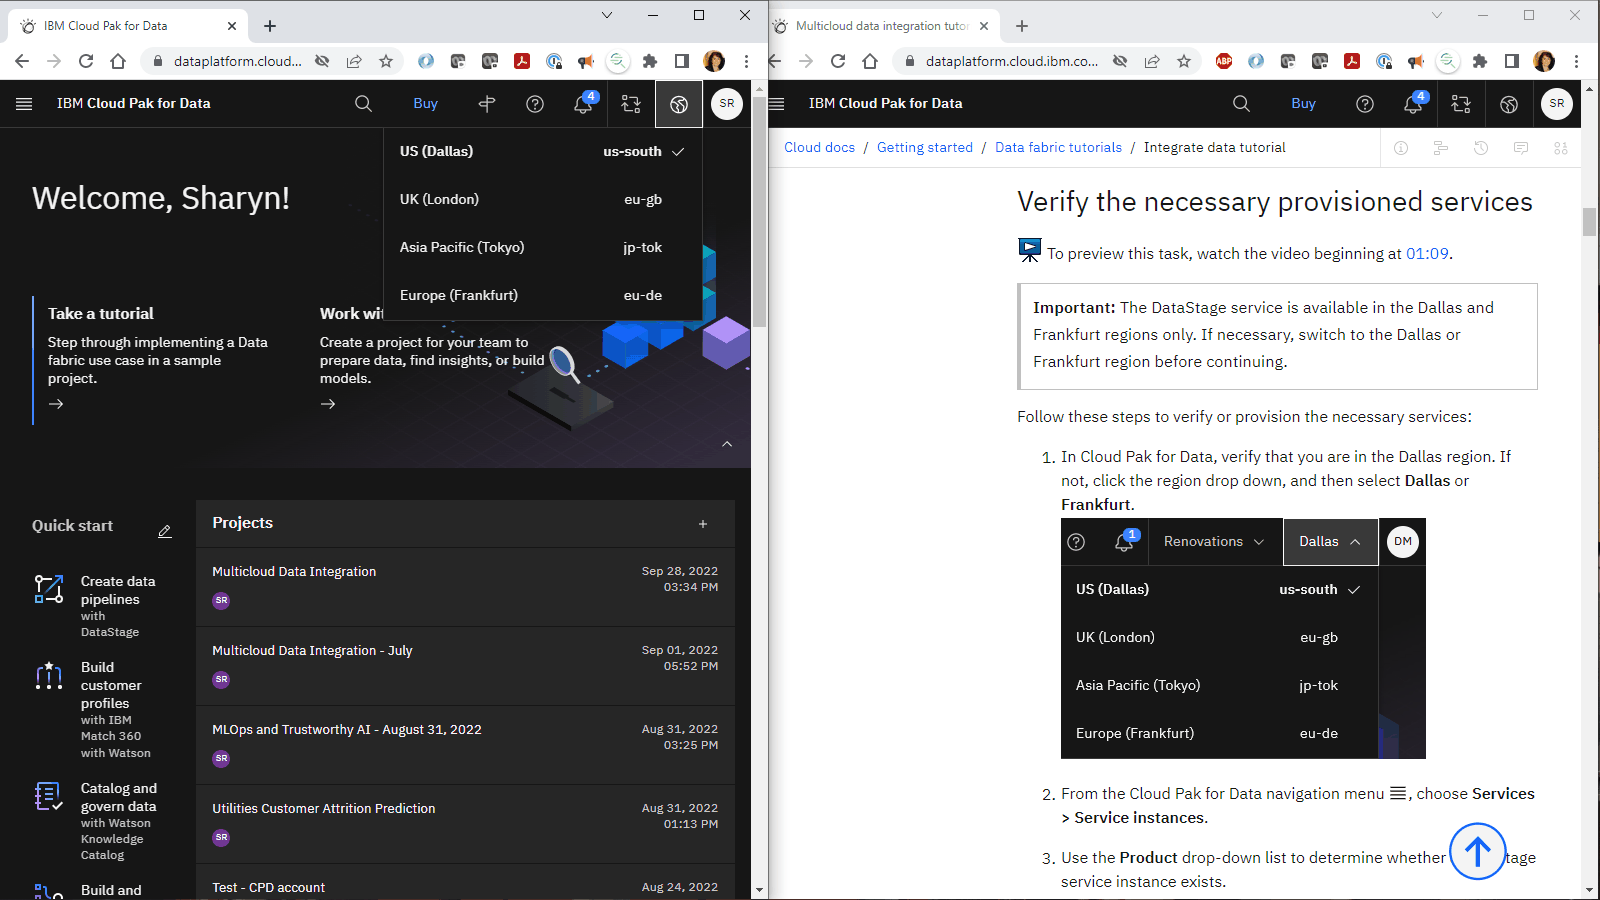
For the optimal experience completing this tutorial, open Cloud Pak for Data in one browser window, and keep this tutorial page open in another browser window to switch easily between the two applications. Consider arranging the two browser windows side-by-side to make it easier to follow along.
Set up the prerequisites
Prerequisites
Sign up for Cloud Pak for Data as a Service
You must sign up for Cloud Pak for Data as a Service and provision the necessary services for the Data integration use case.
- If you have an existing Cloud Pak for Data as a Service account, then you can get started with this tutorial. If you have a Lite plan account, only one user per account can run this tutorial.
- If you don't have a Cloud Pak for Data as a Service account yet, then sign up for a data fabric trial.
![]() Watch the following video to learn about data fabric in Cloud Pak for Data.
Watch the following video to learn about data fabric in Cloud Pak for Data.
This video provides a visual method to learn the concepts and tasks in this documentation.
Verify the necessary provisioned services
 To preview this task, watch the video beginning at 01:08.
Follow these steps to verify or provision the necessary services:
-
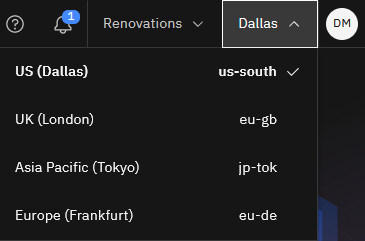
In Cloud Pak for Data, verify that you are in the Dallas or Frankfurt region. If not, click the region drop down, and then select Dallas or Frankfurt.
-
From the Navigation menu
, choose Services > Service instances.
-
Use the Product drop-down list to determine whether a DataStage service instance exists.
-
If you need to create a DataStage service instance, click Add service.
-
Select DataStage.
-
For the region, select Dallas or Frankfurt.
-
Select the Lite plan.
-
Click Create.
-
-
Repeat these steps to verify or provision the following additional services:
- IBM Knowledge Catalog
- Cloud Object Storage
 Check your progress
The following image shows the provisioned service instances:

Create the sample project
 To preview this task, watch the video beginning at 01:44.
If you already have the sample project for this tutorial, then skip to Task 1. Otherwise, follow these steps:
-
Access the Data integration sample project in the Resource hub.
-
Click Create project.
-
If prompted to associate the project to a Cloud Object Storage instance, select a Cloud Object Storage instance from the list.
-
Click Create.
-
Wait for the project import to complete, and then click View new project to verify that the project and assets were created successfully.
-
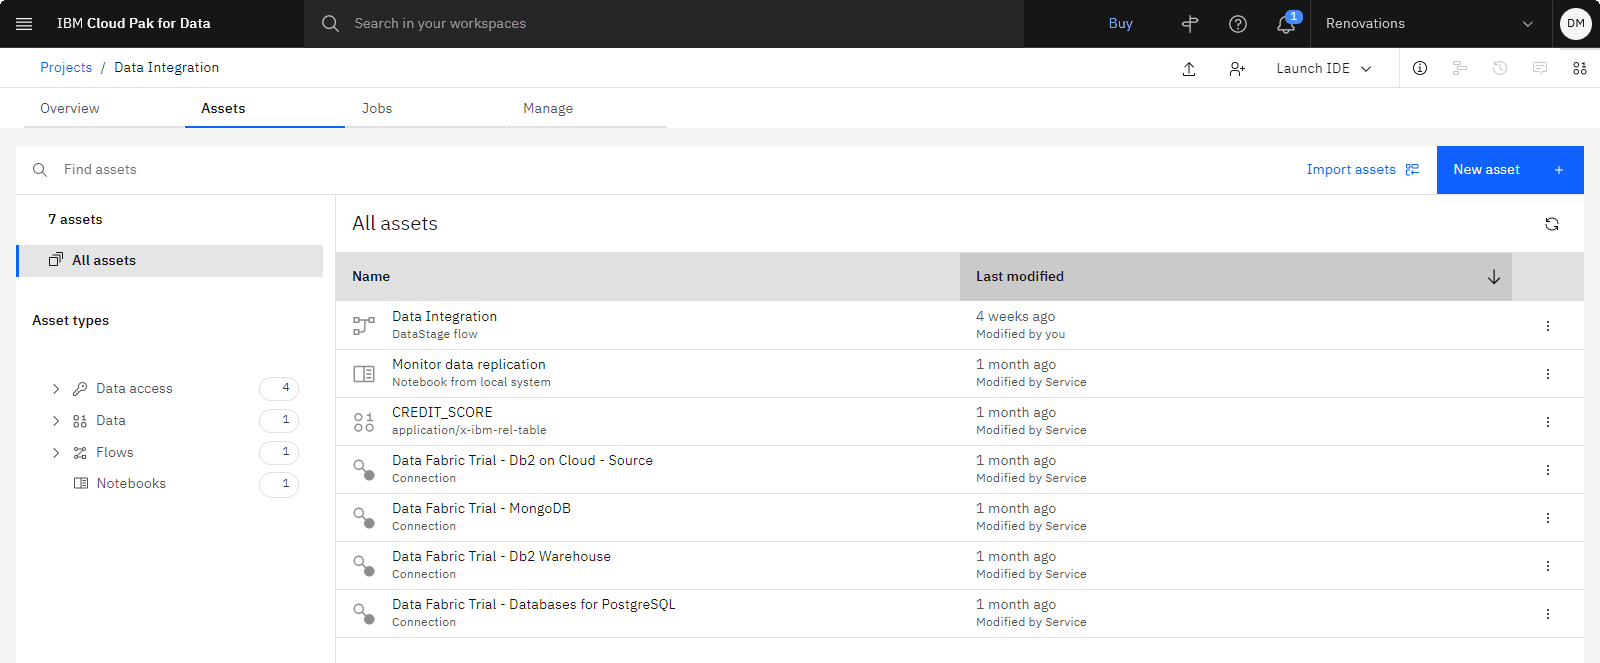
Click the Assets tab to see the connections and DataStage flow.
 Check your progress
The following image shows the Assets tab in the sample project. You are now ready to start the tutorial.
Task 1: Run an existing DataStage flow
 To preview this task, watch the video beginning at 02:29.
Start with a basic DataStage flow that joins the mortgage applicants and mortgage applications data sets, and then outputs that result to a CSV file in the project. Follow these steps to run the DataStage flow:
-
Start in the Data integration project. If you don't have the project open, follow these steps:
-
From the Navigation menu
, choose Projects > View all projects.
-
Open the Data integration project.
-
-
Click the Assets tab to see all of the assets in the project.
-
Click Flows > DataStage flows.
Tip: If you don't see any DataStage flows, then go back to view your service instances to verify your DataStage instance provisioned successfully. See Provision the necessary services. -
Click the Data integration flow in the list to open it. This flow joins the Mortgage Applicants and Mortgage Applications tables that are stored in Db2 Warehouse, filters the data to those records from the State of California, and creates a sequential file in CSV format as the output.
-
Click the zoom in icon
and zoom out icon
on the toolbar to set your preferred view of the canvas.
-
Double-click MORTGAGE_APPLICATIONS_1 node to view the settings.
-
Expand the Properties section.
-
Scroll down, and then click Preview data. This data set includes information that is captured on a mortgage application.
-
Click Close.
-
-
Double-click MORTGAGE_APPLICANTS_1 node to view the settings.
-
Expand the Properties section.
-
Scroll down, and click Preview data. This data set includes information about mortgage applicants who applied for a loan.
-
Optional: Visualize the data.
-
Click the Chart panel.
-
In the Columns to visualize list, select STATE.
-
Click Visualize data to see a pie chart showing the distribution of the data by state.
-
Click the Treemap icon to see the same data in a treemap chart.
-
-
Click Close.
-
-
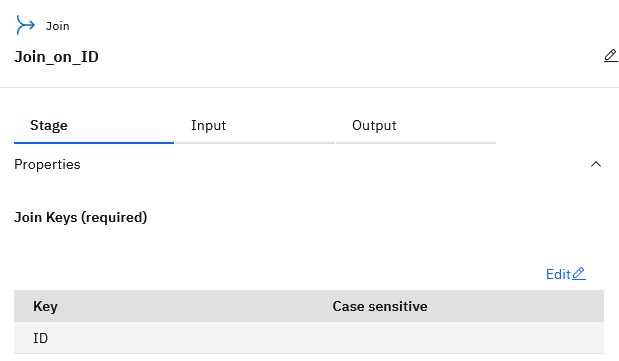
Double-click Join_on_ID node to view the settings.
-
Expand the Properties section.
-
Note that the join key is the ID column.
-
Click Cancel to close the settings.
-
-
Click the Logs icon
 on the toolbar so you can watch the flow's progress.
 -
Click Compile, and then click Run. Alternatively, you can click Run which compiles and then runs the DataStage flow. The run can take about one minute to complete.
-
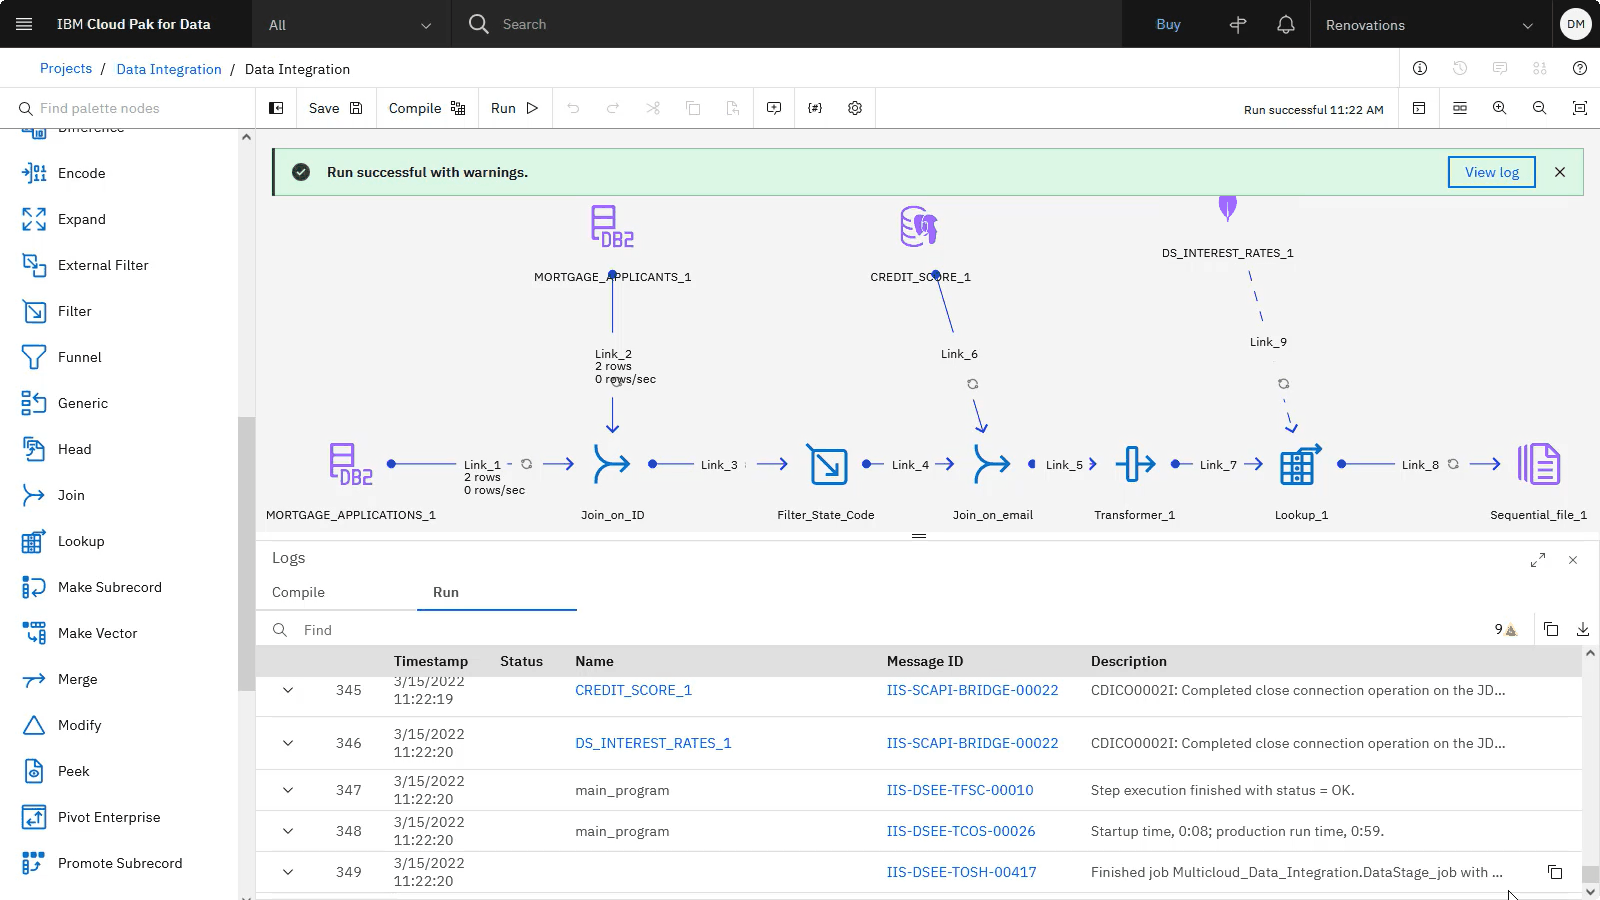
View the logs. You can use the total rows and rows/sec for each step in the flow to visually verify that the filter is working as expected.
-
When the run completes successfully, click Data integration in the navigation trail to return to the project.

-
On the Assets tab, click Data > Data assets.
-
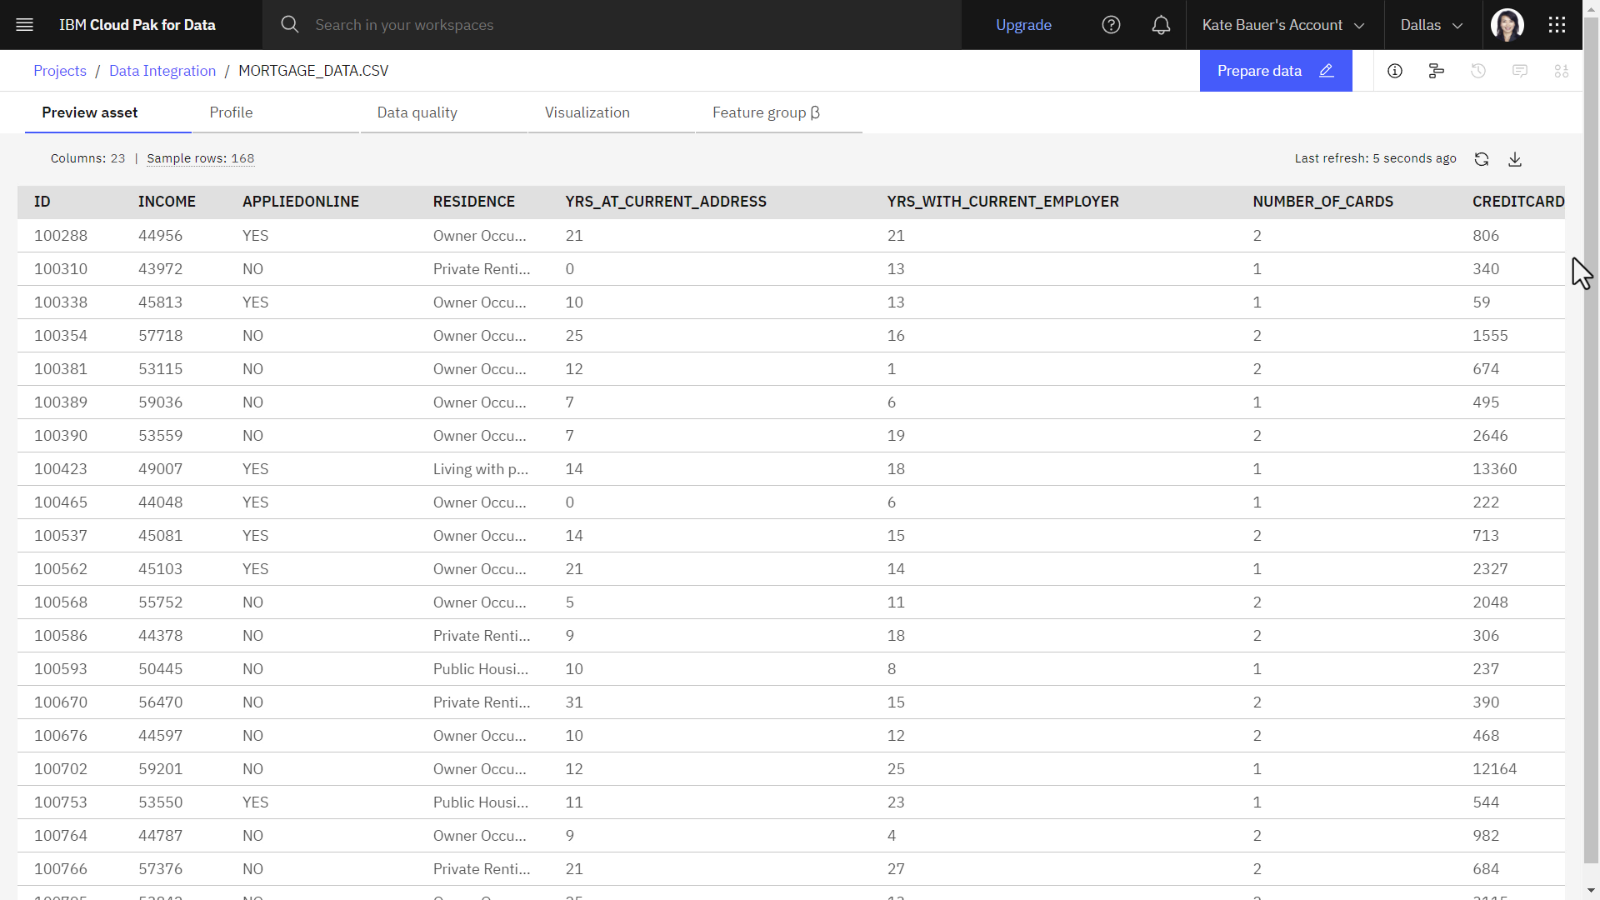
Open the MORTGAGE_DATA.CSV file. You can see that this file contains the columns from both the mortgage applicants and mortgage applications data sets.
 Check your progress
The following image shows resulting CSV file. The next task is to edit the DataStage flow.
Overview: Edit the DataStage flow
Now that you joined the mortgage applicant and application data, you are ready to edit the DataStage flow to:
- Task 2: Specify a key column for the Join stage.
- Task 3: Add credit score data from a PostgreSQL database.
- Task 4: Add a Join stage to join the credit score data with the applicant and application data.
- Task 5: Add a Transformer stage to calculate total debt.
- Task 6: Add interest rate data from a MongoDB database.
- Task 7: Add a Lookup stage to look up interest rates for applicants based on their credit scores and Golden Bank's daily interest rate ranges.
Task 2: Specify the key column for the Join stage
 To preview this task, watch the video beginning at 04:42.
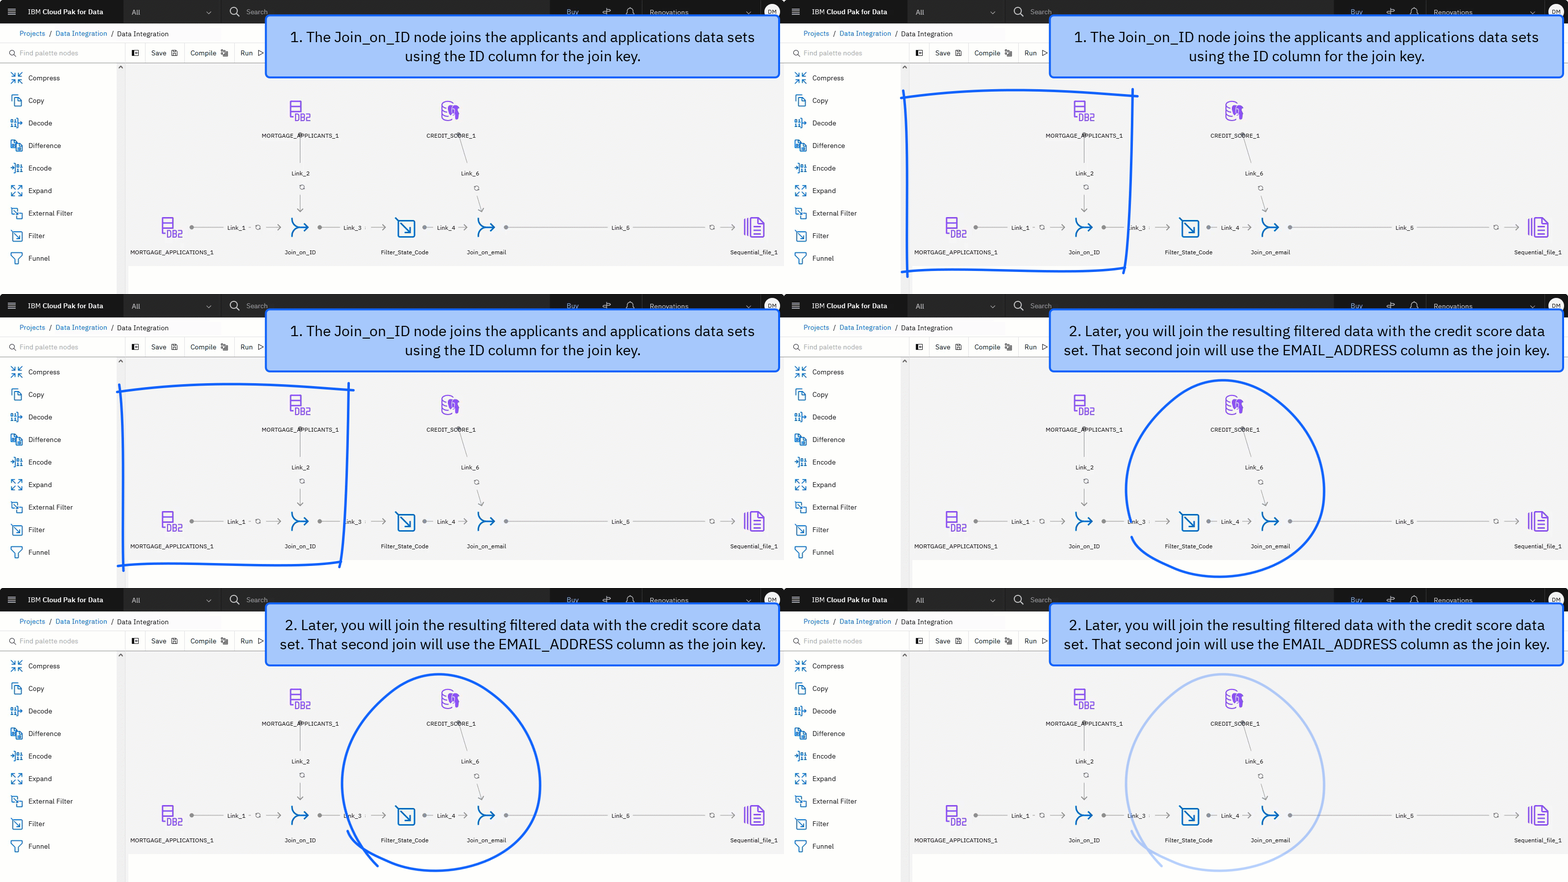
Identifying a key column indicates to DataStage that column contains unique values. The Join_on_ID node joins the mortgage applicants and mortgage applications data sets using the ID column for the join key. The next phase is to join the resulting data set with the credit score data. Later, you will join the resulting filtered data with the credit score data set. The second join will use the EMAIL_ADDRESS column as the join key. In this task, you edit the DataStage flow to specify the EMAIL_ADDRESS column as the key column for the resulting data set when it is joined with the credit score data.
The following animated image provides a visual representation as an alternative to the description of the two join nodes. Click the image to view a larger image.
Follow these steps to change the Join node settings:
-
Click Data integration in the navigation trail to return to the project.

-
On the Assets tab, click Flows > DataStage flows.
-
Open the Data integration flow.
-
Double-click the Join_on_ID node to edit the settings.
-
Click the Output tab, and expand the Columns section to see a list of the columns in the joined data set.
-
Click Edit.
-
For the EMAIL_ADDRESS column name, select Key.
-
Click Apply and return to return to the Join_on_ID node settings.
-
Click Save to save the Join_on_ID node settings.
 Check your progress
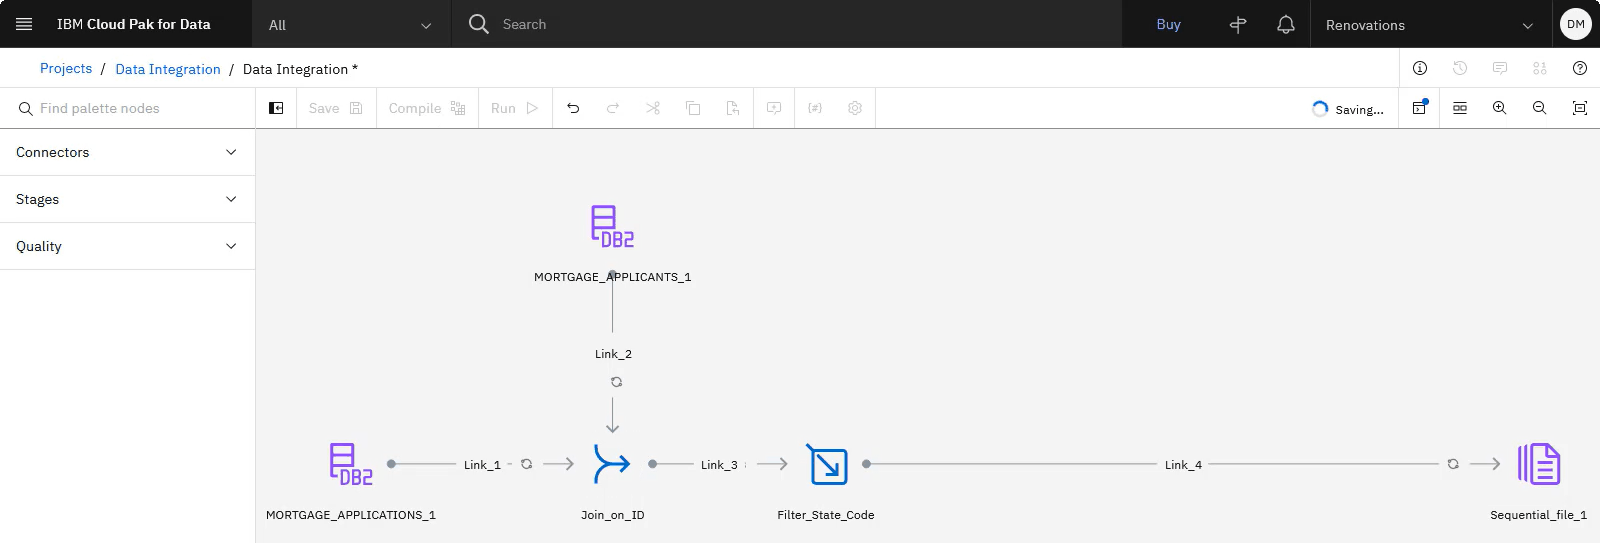
The following image shows the DataStage flow with the edited Join_on_id stage. Now that you identified the EMAIL_ADDRESS column as the key column, you can add the PostgreSQL data containing the applicants credit scores.
Task 3: Add credit score data from a PostgreSQL database
 To preview this task, watch the video beginning at 05:23.
Follow these steps to add the credit score data that is stored in a PostgreSQL database to the DataStage flow:
-
In the node palette, expand the Connectors section.
-
Drag the Asset browser connector to the canvas beside the MORTGAGE_APPLICANTS_1 node.
-
Locate the asset by selecting Connection > Data Fabric Trial - Databases for PostgreSQL > BANKING > CREDIT_SCORE.
Note: Click the connection or schema name instead of the checkbox to expand the connection and schema.
-
Click the Preview icon
to preview the credit score data for each applicant.
-
Click Add.
 Check your progress
The following image shows the DataStage flow with the credit score asset added. Now that you added the credit score data to the canvas, you need to join the applicant, application, and credit score data.

Task 4: Add a Join stage to join the credit score data with the applicant and application data
 To preview this task, watch the video beginning at 05:54.
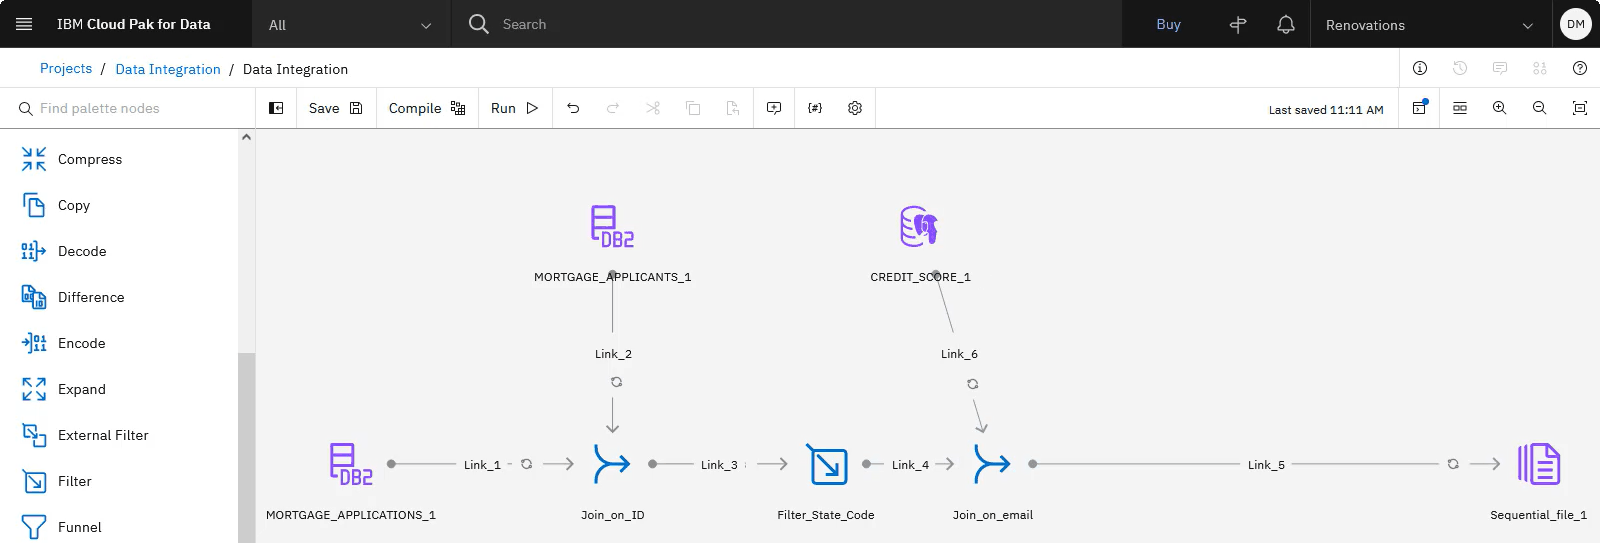
Follow these steps to add another Join stage to join the filtered mortgage application and mortgage applicant joined data with the credit score data in the DataStage flow:
-
In the node palette, expand the Stages section.
-
Drag the Join stage on to the canvas, and drop the node on the link line between the Filter_State_Code and Sequential_file_1 nodes.
-
Hover over the CREDIT_SCORE_1 connector to see the arrow. Connect the arrow to the Join stage.
-
Double-click the CREDIT_SCORE_1 node to edit the settings.
-
Click the Output tab, and expand the Columns section to see a list of the columns in the joined data set.
-
Click Edit.
-
For the EMAIL_ADDRESS and CREDIT_SCORE column names, select Key.
-
Click Apply and return to return to the CREDIT_SCORE_1 node settings.
-
Click Save to save the CREDIT_SCORE_1 node settings.
-
-
Double-click the Join_1 node to edit the settings.
-
Expand the Properties section.
-
Click Add key.
-
Click Add key again.
-
Select EMAIL_ADDRESS from the list of possible keys.
-
Click Apply.
-
-
Click Apply and return to return to the Join_1 node settings.
-
Change the Join_1 node name to
Join_on_email. -
Click Save to save the Join_1 node settings.
-
 Check your progress
The following image shows the DataStage flow with a second Join stage added. Now that you joined the application, applicant, and credit score data, you need to add a Transformer stage to calculate each applicant's total debt.
Task 5: Add a Transformer stage to calculate total debt
 To preview this task, watch the video beginning at 07:08.
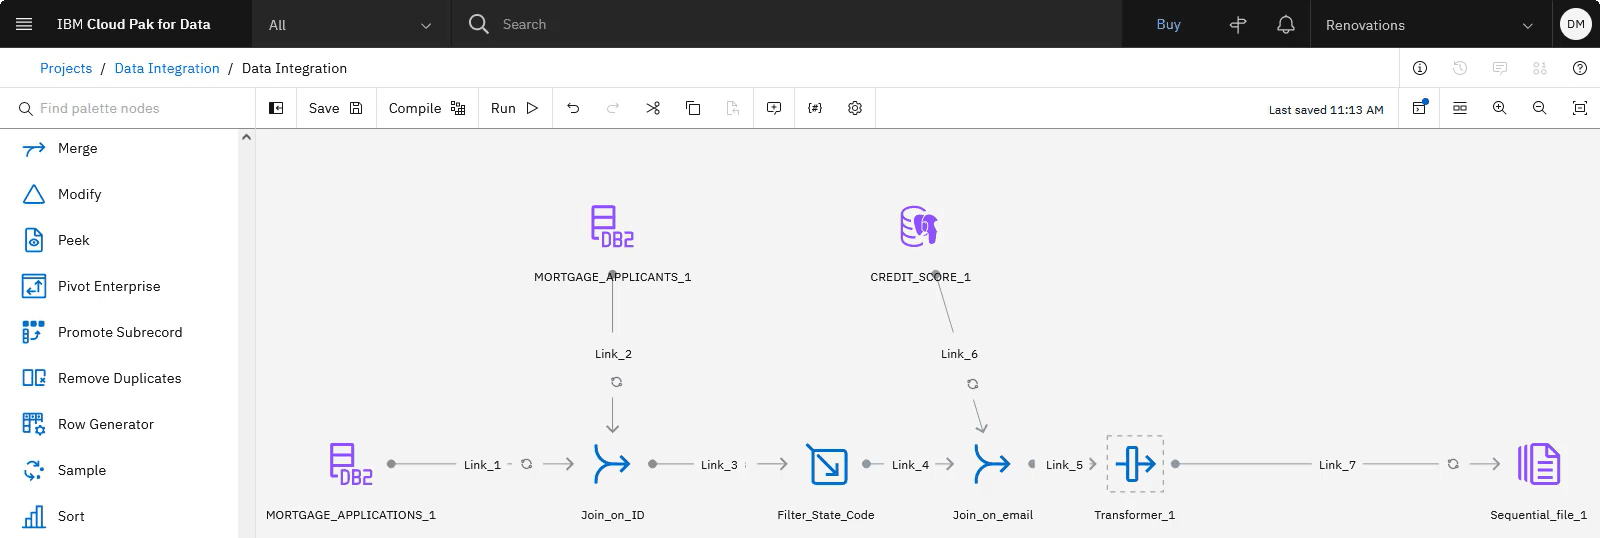
Follow these steps to add a Transformer stage that creates a new column by summing the LOAN_AMOUNT and CREDITCARD_DEBT columns:
-
In the Stages section, drag the Transformer stage on to the canvas, and drop the node on the link line between the Join_on_email and Sequential_file_1 nodes.
-
Double-click the Transformer node to edit the settings.
-
Click the Output tab.
-
Click Add column.
-
Scroll down in the list of columns to see the new column.
-
Name the column
TOTAL_DEBT. -
Click the Edit icon
in the row’s Derivation column.
-
Click the Calculator icon
in the Derivation column to open the expression builder.
-
Search for
LOAN_AMOUNT, and double-click the column name to add it to the expression. Note that the link number is appended to the column name. -
Type a plus sign
+. -
Search for
CREDITCARD_DEBT, and then double-click the column name to add it to the expression. Note that the link number is appended to the column name. -
Verify that the final expression is
Link_7.LOAN_AMOUNT + Link_7.CREDITCARD_DEBT.Note: Your link number may be different. -
Click Apply and return to return to the Transformer page.
-
For the CREDIT_SCORE column name, select Key.
-
-
Click the Stage tab.
-
Select the Advanced page.
-
Change the Execution mode to Sequential.
-
-
Click Save and return to return to the canvas.
 Check your progress
The following image shows the DataStage flow with the Transformer stage added. Now that you calcluated each applicant's total debt, you need to add the table of interest rates to offer based on credit score ranges.
Task 6: Add interest rate data from a MongoDB database
 To preview this task, watch the video beginning at 08:15.
Follow these steps to include the interest rates in the flow by adding a data asset connector to a MongoDB database:
-
In the node palette, expand the Connectors section.
-
Drag the Asset browser connector on to the canvas beside the CREDIT_SCORE_1 node.
-
Locate the asset by selecting Connection > Data Fabric Trial - Mongo DB > DOCUMENT > DS_INTEREST_RATES.
-
Click the Preview icon
to preview interest rates for each credit score range.

You can use the values in the STARTING_LIMIT and ENDING_LIMIT columns to look up the appropriate interest rate based on the applicant's credit score. The ID column is not needed, so you will delete that column in the next step. -
Click Add.
 Check your progress
The following image shows the DataStage flow with the interest rates data asset added from the MongoDB external source. Now that you added the interest rates table, you can look up the appropriate interest rate for each applicant.
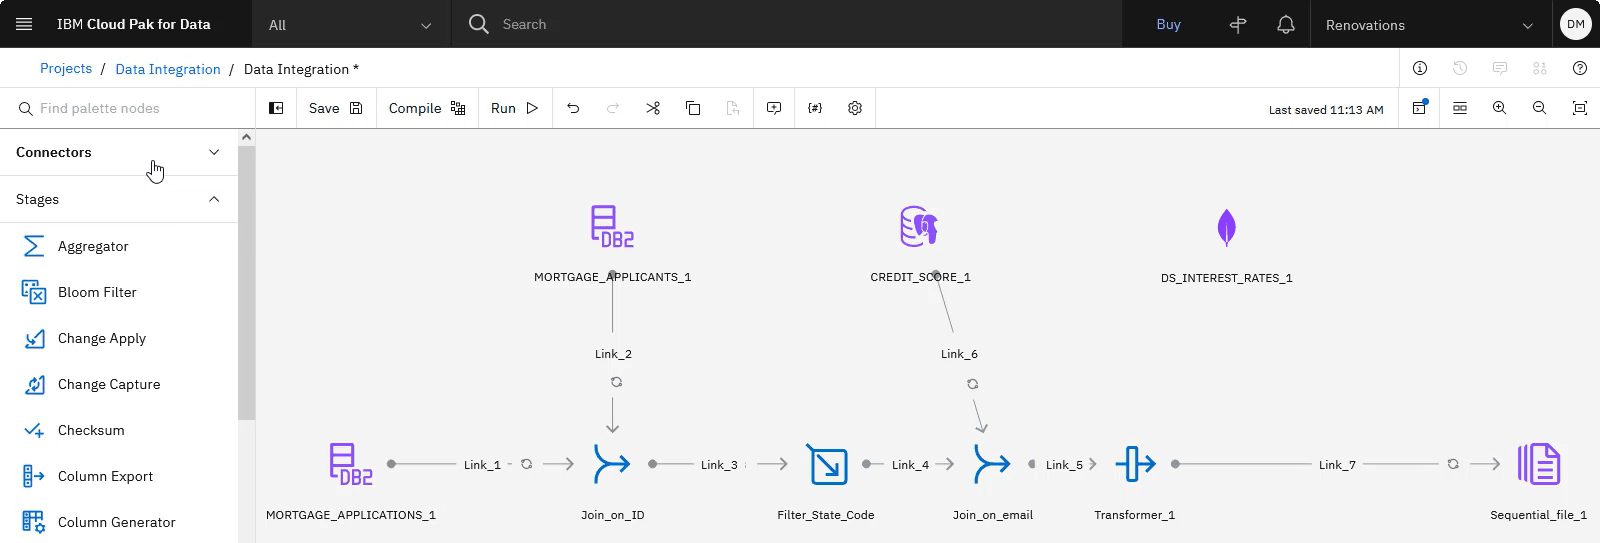
Task 7: Add a Lookup stage to look up interest rates for applicants
 To preview this task, watch the video beginning at 09:00.
Based on each applicant's credit score, you want to look up the appropriate interest rate. Follow these steps to add a Lookup stage and specify the range for starting and ending credit score limits for each interest rate:
-
In the Stages section, drag the Lookup stage on to the canvas, and drop the node on the link line between the Transformer_1 and Sequential_file_1 nodes.
-
Connect the DS_INTEREST_RATES_1 connector to the Lookup_1 stage.
-
Double-click the DS_INTEREST_RATES_1 node to edit the settings.
-
Click the Output tab.
-
Expand the Columns section, and click Edit.
-
Select the _ID column.
-
Click the Delete icon
to delete the _ID column.
-
Click Apply and return to return to the DS_INTEREST_RATES_1 node settings.
-
Click Save to save the changes to the DS_INTEREST_RATES_1 node.
-
-
Double-click the Lookup_1 node to edit the settings.
-
Expand the Properties section.
-
For the Apply range to columns field, select CREDIT_SCORE. The Reference Links, Operator, and Range column fields display.
-
For the Reference Links, select Link_9.
Note: Your link number may be different. -
For the first Operator, select <=.
-
For the first Range column, select ENDING_LIMIT.
-
For the second Operator, select >=.
-
For the second Range column, select STARTING_LIMIT.
-
-
Click the Output tab.
-
Expand the Columns section, and click Edit.
-
Select the STARTING_LIMIT and ENDING_LIMIT columns.
-
Click the Delete icon
to delete these unnecessary STARTING_LIMIT and ENDING_LIMIT columns.
-
Click Apply and return to return to the Lookup_1 node settings.
-
Click Save to save the changes to the Lookup_1 node.
-
 Check your progress
The following image shows that the DataStage flow with the Lookup stage added. The DataStage flow is now complete. The last task before running the flow is to specify the name for the output file.

Task 8: Edit the Sequential file node and run the DataStage flow
 To preview this task, watch the video beginning at 10:22.
Follow these steps to edit the Sequential file node to create a final output file as a data asset in the project, and then compile and run the DataStage flow:
-
Double-click the Sequential_file_1 node to edit the settings.
-
Click the Input tab.
-
Expand the Properties section.
-
For the Target File, copy and paste
MORTGAGE_APPLICANTS_INTEREST_RATES.CSVfor the file name. -
Select Create data asset.
-
For the First line is column names field, select True.
-
Click Save.
-
Click Run which compiles and then runs the DataStage flow. The job takes about 1 minute to complete.
-
Click Logs on the toolbar to watch the flow's progress. It is normal to see warnings during the run, and then you see that the flow ran successfully.
 Check your progress
The following image shows that the DataStage flow ran successfully. Now that the DataStage flow created the output file, you need to create the catalog where you will publish the output file.
Task 9: Create a catalog to store the published data asset
 To preview this task, watch the video beginning at 11:00.
Other data engineers and business analysts at Golden Bank need access to the mortgage interest rates. With the IBM Knowledge Catalog Lite plan, you can create two catalogs. If you already have a catalog, skip this step. Otherwise, complete the following steps to create a catalog to which you can publish the interest rates data set.
-
From the Navigation menu
, choose Catalogs > View all catalogs.
-
If you see a Mortgage Approval Catalog on the Catalogs page, then skip to Task 10: View the output and publish to a catalog. Otherwise, follow these steps to create a new catalog:
-
Click Create Catalog.
-
For the Name, copy and paste the catalog name exactly as shown with no leading or trailing spaces:
Mortgage Approval Catalog -
Select Enforce data protection rules, confirm the selection, and accept the defaults for the other fields.
-
Click Create.
 Check your progress
The following image shows your catalog. Now that you the Mortgage Approval Catalog exists, you can publish the output file to the catalog.

Task 10: View the output and publish to a catalog
 To preview this task, watch the video beginning at 11:31.
Follow these steps to view the output file in the project, and then publish it to a catalog:
-
From the Navigation menu
, choose Projects > View all projects.
-
Open the Data integration project.
-
On the Assets tab, click Data > Data assets.
-
Open the MORTGAGE_APPLICANTS_INTEREST_RATES.CSV file.
-
Scroll to see all of the columns in your integrated data set with interest rates at the end of each data entry.
-
Click Data integration in the navigation trail to return to the project.
-
On the Assets tab, click the Overflow menu
at the end of the row for the MORTGAGE_APPLICANTS_INTEREST_RATES.CSV file, and choose Publish to catalog.
-
Select the Mortgage Approval Catalog (or your catalog name) from the list, and click Next.
-
Select the option to Go to the catalog after publishing it, and click Next.
-
Review the assets, and click Publish.
-
-
In the catalog, search for
Mortgage. -
Open the MORTGAGE_APPLICANTS_INTEREST_RATES.CSV file.
-
Click Asset tab to view the data.
 Check your progress
The following image shows the MORTGAGE_APPLICANTS_INTEREST_RATES.CSV file in catalog. The data that lenders need to make mortgage decisions is now available.
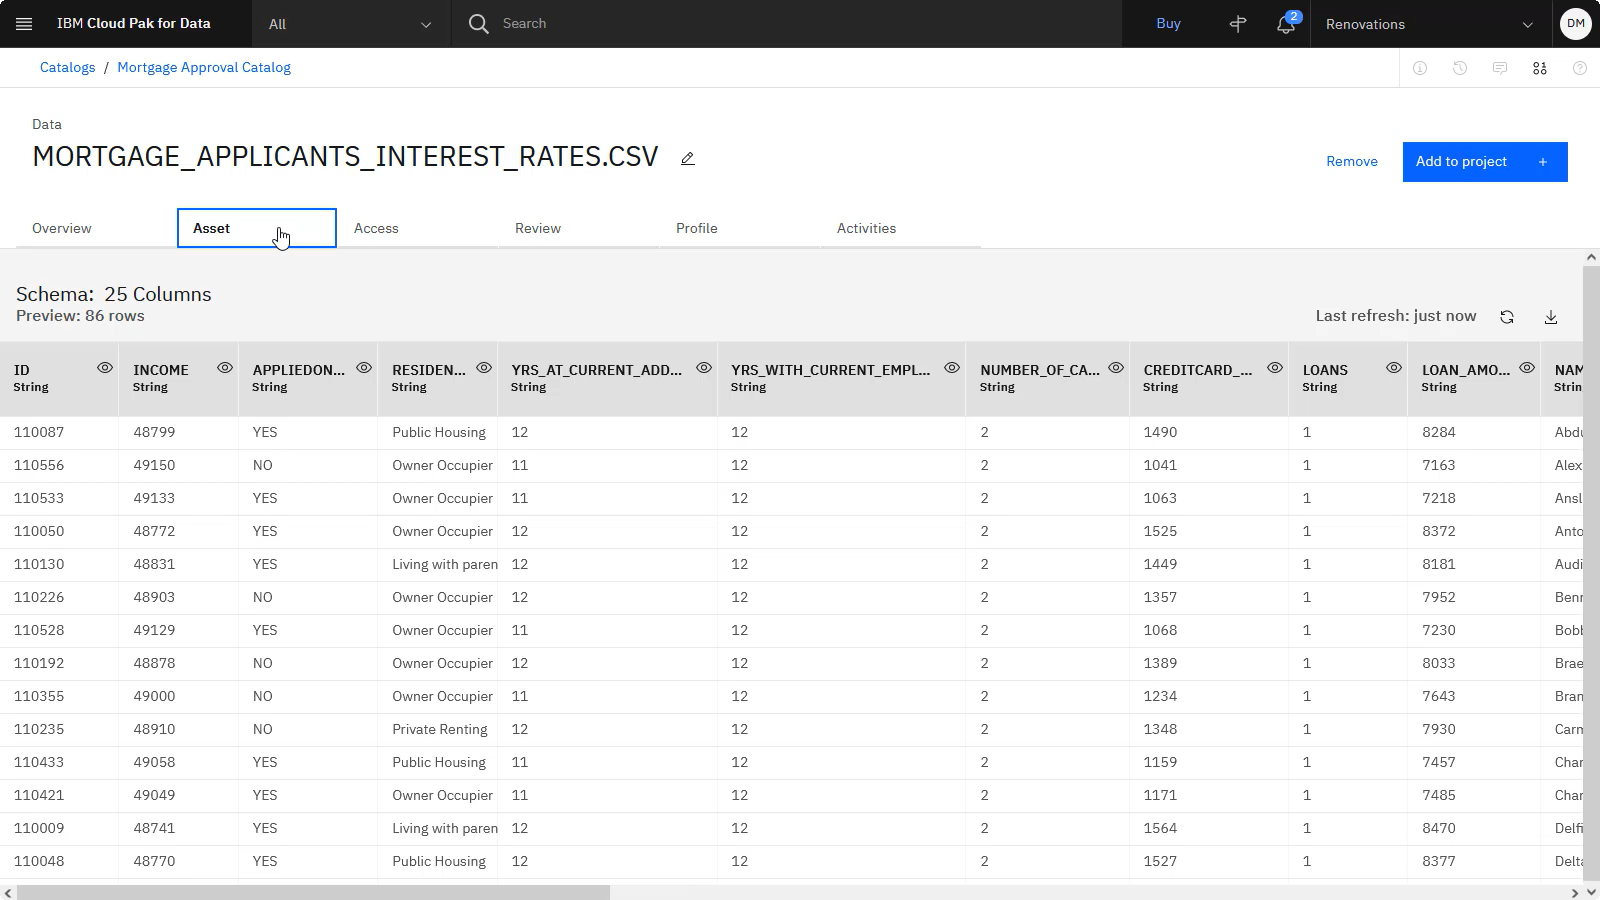
As a data engineer at Golden Bank, you integrated the mortgage applicant, application, credit rating, and credit score information, and published that data in a catalog.
Cleanup (Optional)
If you would like to retake the tutorials in the Data integration use case, delete the following artifacts.
| Artifact | How to delete |
|---|---|
| Mortgage Approval Catalog | Delete a catalog |
| Data integration sample project | Delete a project |
Next steps
Learn more
Parent topic: Use case tutorials
