You can tell a story about your data without coding by creating and sharing an interactive dashboard. Read about the dashboard editor, then watch a video and take a tutorial that’s suitable for beginners and does not require coding.
- Required services
- Watson Studio
- Cognos Dashboard Embedded
Your basic workflow includes these tasks:
- Create a project. Projects are where you can collaborate with others to work with data.
- Add your data to the project. You can add CSV files or data from a remote data source through a connection.
- Create a dashboard with the Dashboard editor. If you don't have the Cognos Dashboard Embedded service, you can create one for free.
- Add your data to the dashboard and create your graphs.
- Share your dashboard with others as a read-only web page.
Read about dashboards
With dashboards, you can build sophisticated visualizations of your analytics results, and communicate the insights that you’ve discovered in your data on a dashboard. The dashboard editor provides a graphical builder for a line-of-business user to begin investigating data for patterns and insights. You don’t need to understand coding or SQL to explore the data and gain insights. You can share the results with other users both within your organization and externally through a URL link. Alternatively, you can hand off the dashboard to a data scientist for deeper analysis and predictive modeling.
Watch a video about creating a dashboard
 Watch this video to see how to create a dashboard, view, and use data in customized visualizations, and save and share the dashboard.
This video provides a visual method to learn the concepts and tasks in this documentation.
Try a tutorial to create a dashboard
In this tutorial, you will complete these tasks:
- Task 1: Open a project.
- Task 2: Add the data asset to your project.
- Task 3: Add data to a dashboard.
- Task 4: Visualize data on the first tab in the dashboard.
- Task 5: Visualize data on the second tab in the dashboard.
- Task 6: Interact with visualizations in a dashboard.
- Task 7: Share a dashboard.
This tutorial will take approximately 30 minutes to complete.
Tips for completing this tutorial
Here are some tips for successfully completing this tutorial.
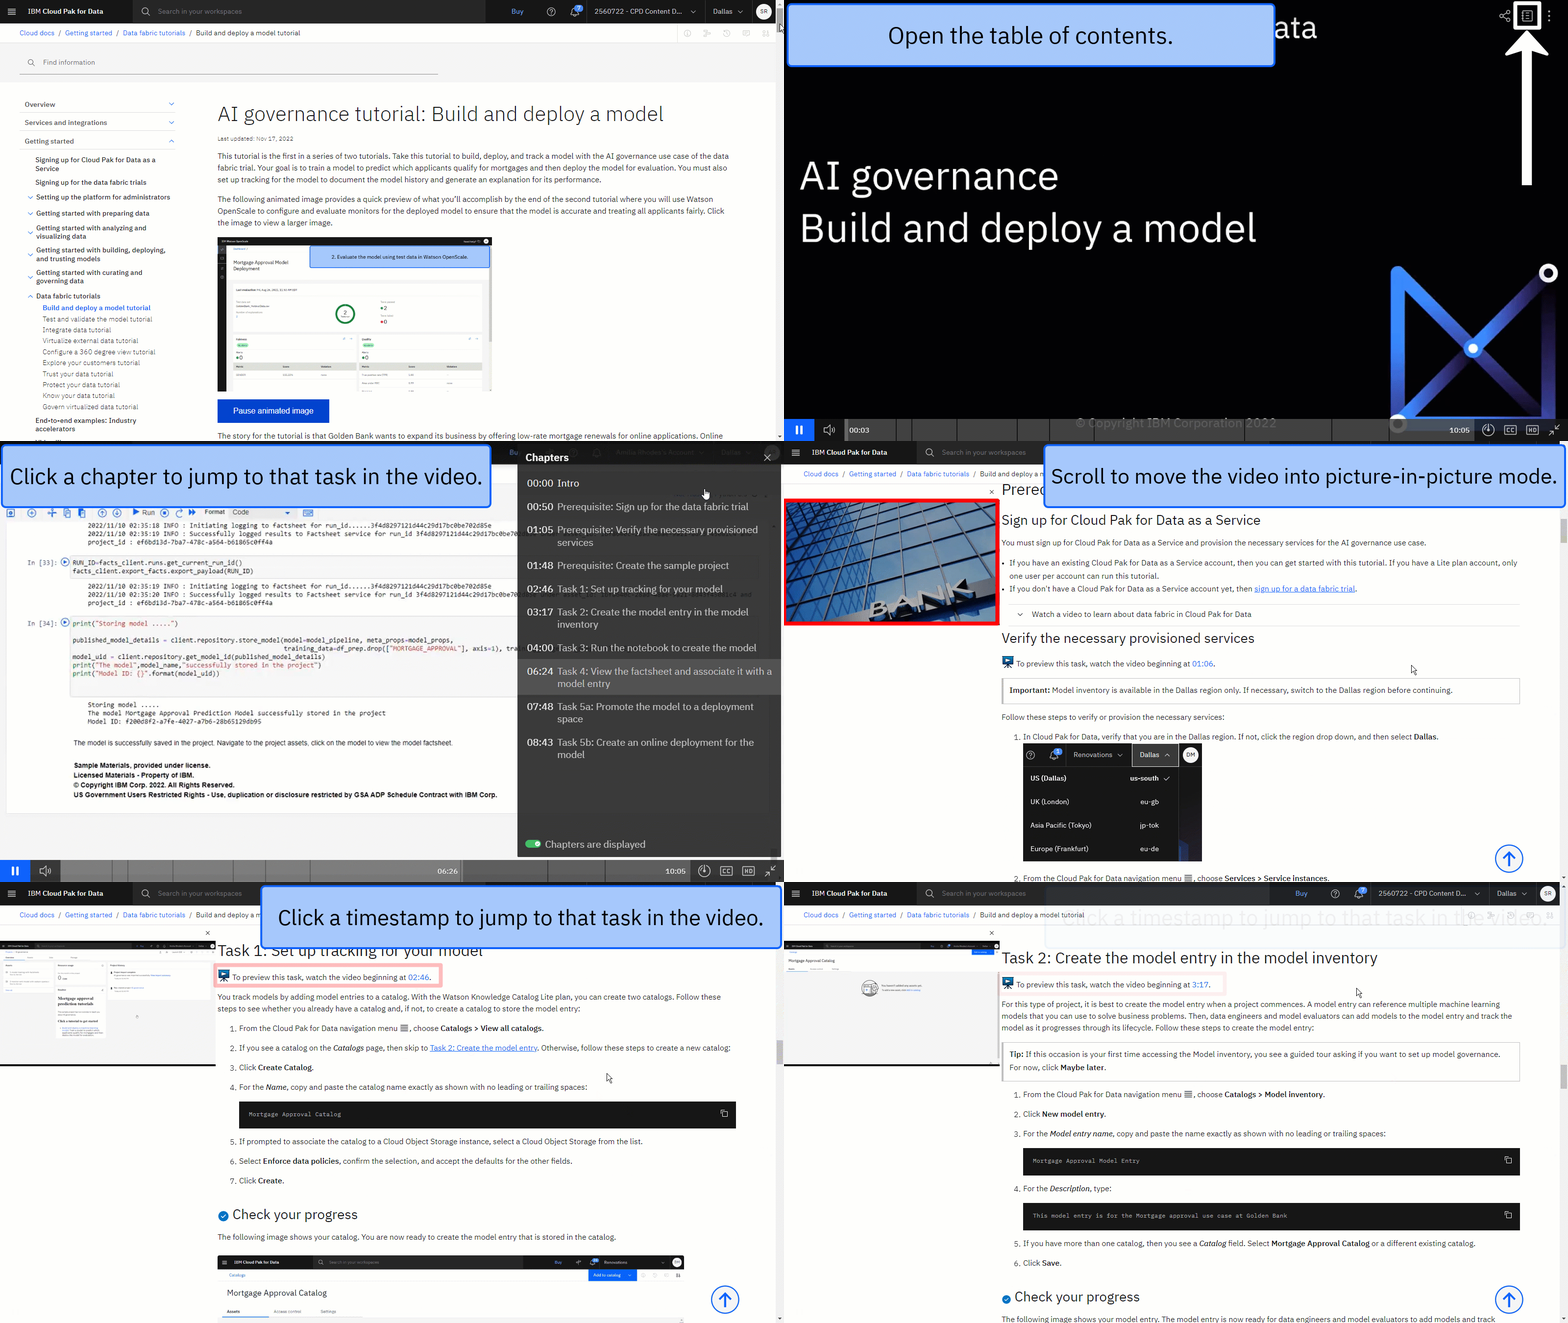
Use the video picture-in-picture
The following animated image shows how to use the video picture-in-picture and table of contents features:
Get help in the community
If you need help with this tutorial, you can ask a question or find an answer in the Cloud Pak for Data Community discussion forum.
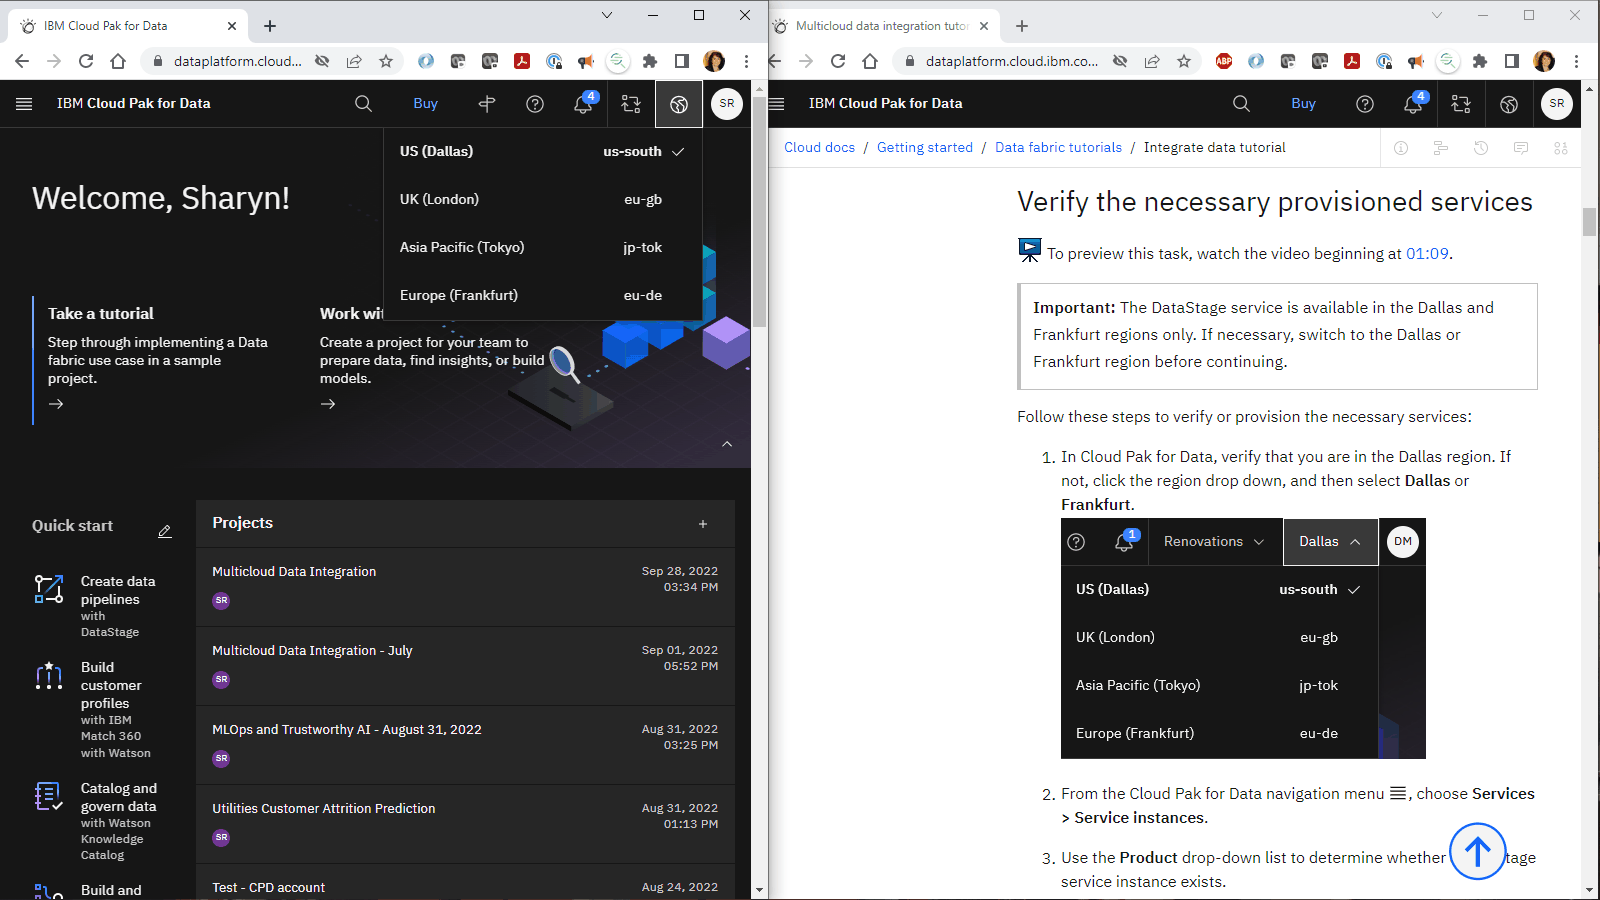
Set up your browser windows
For the optimal experience completing this tutorial, open Cloud Pak for Data in one browser window, and keep this tutorial page open in another browser window to switch easily between the two applications. Consider arranging the two browser windows side-by-side to make it easier to follow along.
Task 1: Open a project
You need a project to store the dashboard. Follow these steps to open an existing project or create a new project and associate the Cognos Dashboard Embedded service with the project:
-
From the Cloud Pak for Data navigation menu
, choose Projects > View all projects
-
If you have an existing project, open it.
-
If you don't have an existing project, then click New project.
-
Select Create an empty project.
-
Enter a name and optional description for the project.
-
Choose an existing object storage service instance or create a new one.
-
Click Create.
-
When the project opens, click the Manage tab, and select the Services and integrations page.
-
On the IBM services tab, click Associate service.
-
If you don't have a Cognos Dashboard Embedded service instance provisioned yet, click New service, select Cognos Dashboard Embedded, and click Create.
-
Select your Cognos Dashboard Embedded instance, and click Associate service.
-
Click Cancel to return to the Services & Integrations page.
For more information or to watch a video, see Creating a project.
For more information on associated services, see Adding associated services.
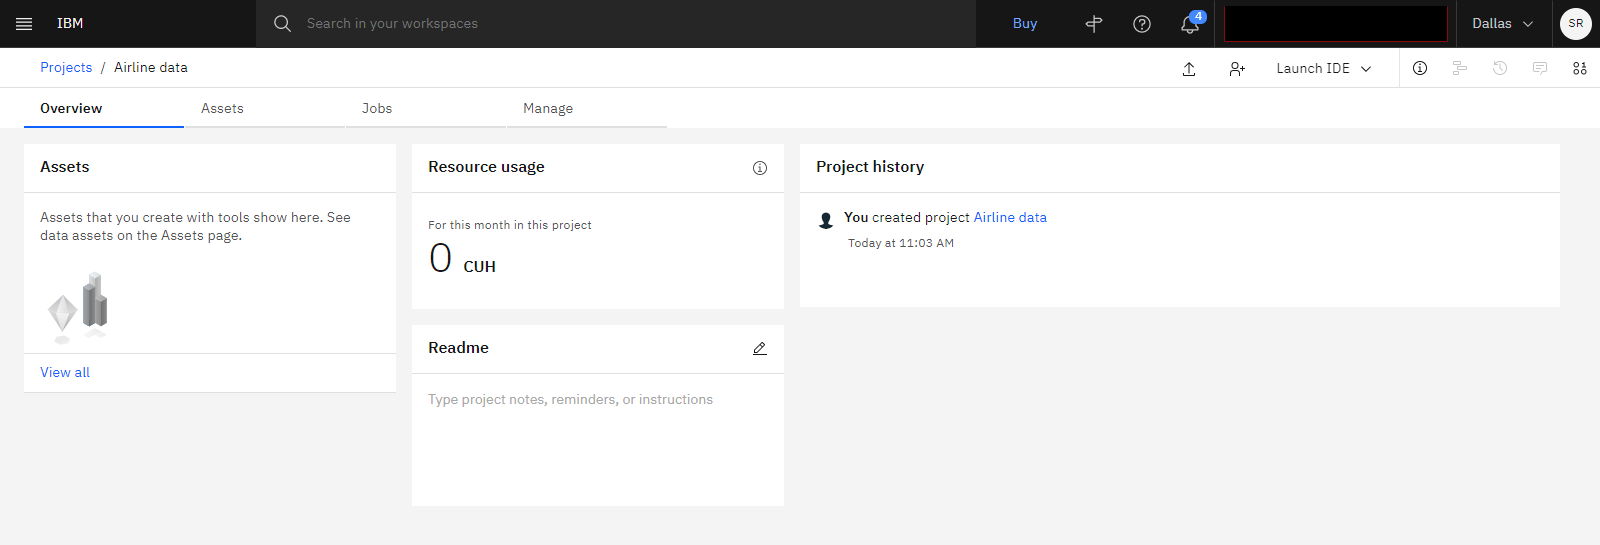
 Check your progress
The following image shows a new, empty project.
Task 2: Add the data set to your project
The data set you will use in this tutorial is available in the Resource hub. Follow these steps to add the data asset to your project:
-
Access the Bakery and weather data in the Resource hub.
-
Click New asset.
-
Select your project from the list, and click Add.
-
After the data set is added, click View Project. You will see the data set on the Assets tab.
For more information on adding a data asset from the Resource hub to a project, see Loading and accessing data in a notebook.
 Check your progress
The following image shows the data asset in the project.

Task 3: Add data to a dashboard
 To preview this task, watch the video beginning at 01:22.
Follow these steps to create a dashboard and select the data source for the dashboard:
-
From your project, click New asset > Dashboard editor.
-
Specify a name for your new dashboard.
-
Select a Cognos Dashboard Embedded service instance from the list.
-
Click Create.
-
In the Tabbed template section, choose the 2 over 1 layout icon that is divided in three sections, and click OK.
-
In the Selected sources panel, click the Add a source + (plus) sign.
-
Select Data asset, and choose
Bakery and weather data.csv. -
Click Select.
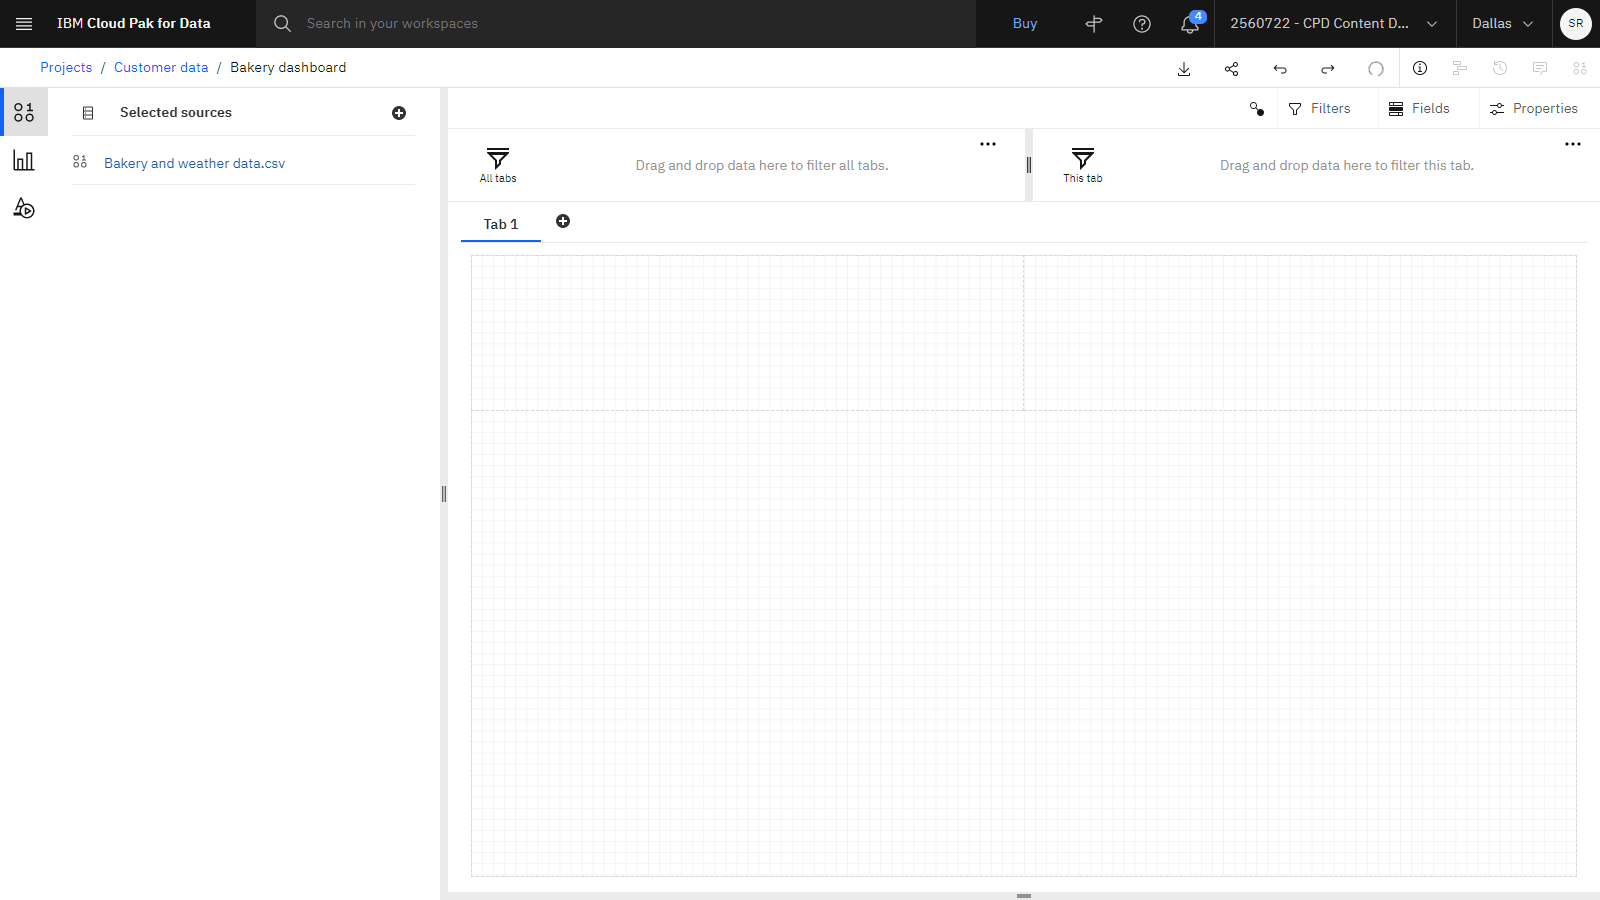
 Check your progress
The following image shows the empty dashboard.
Task 4: Visualize data on the first tab in the dashboard
 To preview this task, watch the video beginning at 02:07.
Follow these steps to add visualizations to the first tab in the dashboard:
-
In the Selected sources panel, click the CSV file source
Bakery and weather data.csvto expand it and view all of the columns from the data set. -
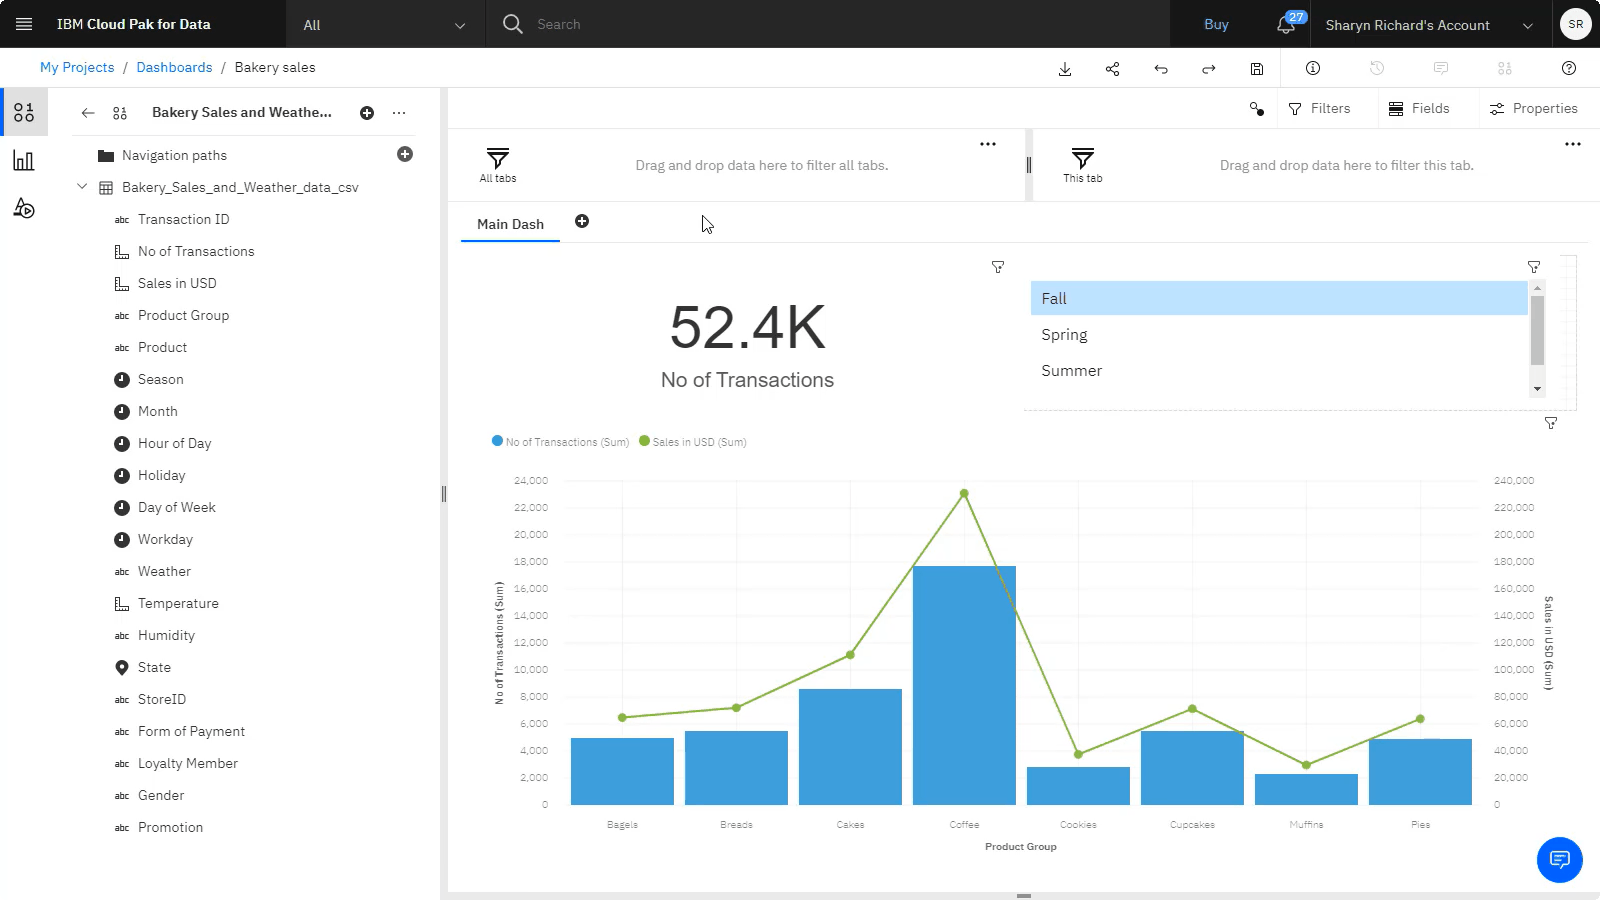
Chart 1: Drag the single column called No of Transactions into the middle of the top left section of the dashboard.
-
Chart 2: You can also select multiple columns. Hold down the Ctrl on your keyboard, and click No of Transactions, Sales in USD, and Product Group to select all three columns of data, then drag the selected columns into the middle of the bottom section of the dashboard. The dashboard service determines the best way to display the selected data.
-
Click Properties to customize visual properties of the chart like colors and labels.
-
Chart 3: Drag the Season column to the middle of the last empty section on the dashboard. You can select different seasons from the list and the other sections of the dashboard will change.
-
Double click Tab 1, and rename the tab to
Main Dash.
 Check your progress
The following image shows the completed Main Dash tab.
Task 5: Visualize data on the second tab in the dashboard
 To preview this task, watch the video beginning at 03:45.
Follow these steps to add visualizations to the second tab in the dashboard:
-
Click the Add new tab icon to create a second tab.
-
In the pane that opens, select the 2 by 2 template icon that is divided in 4 sections, and click OK.
-
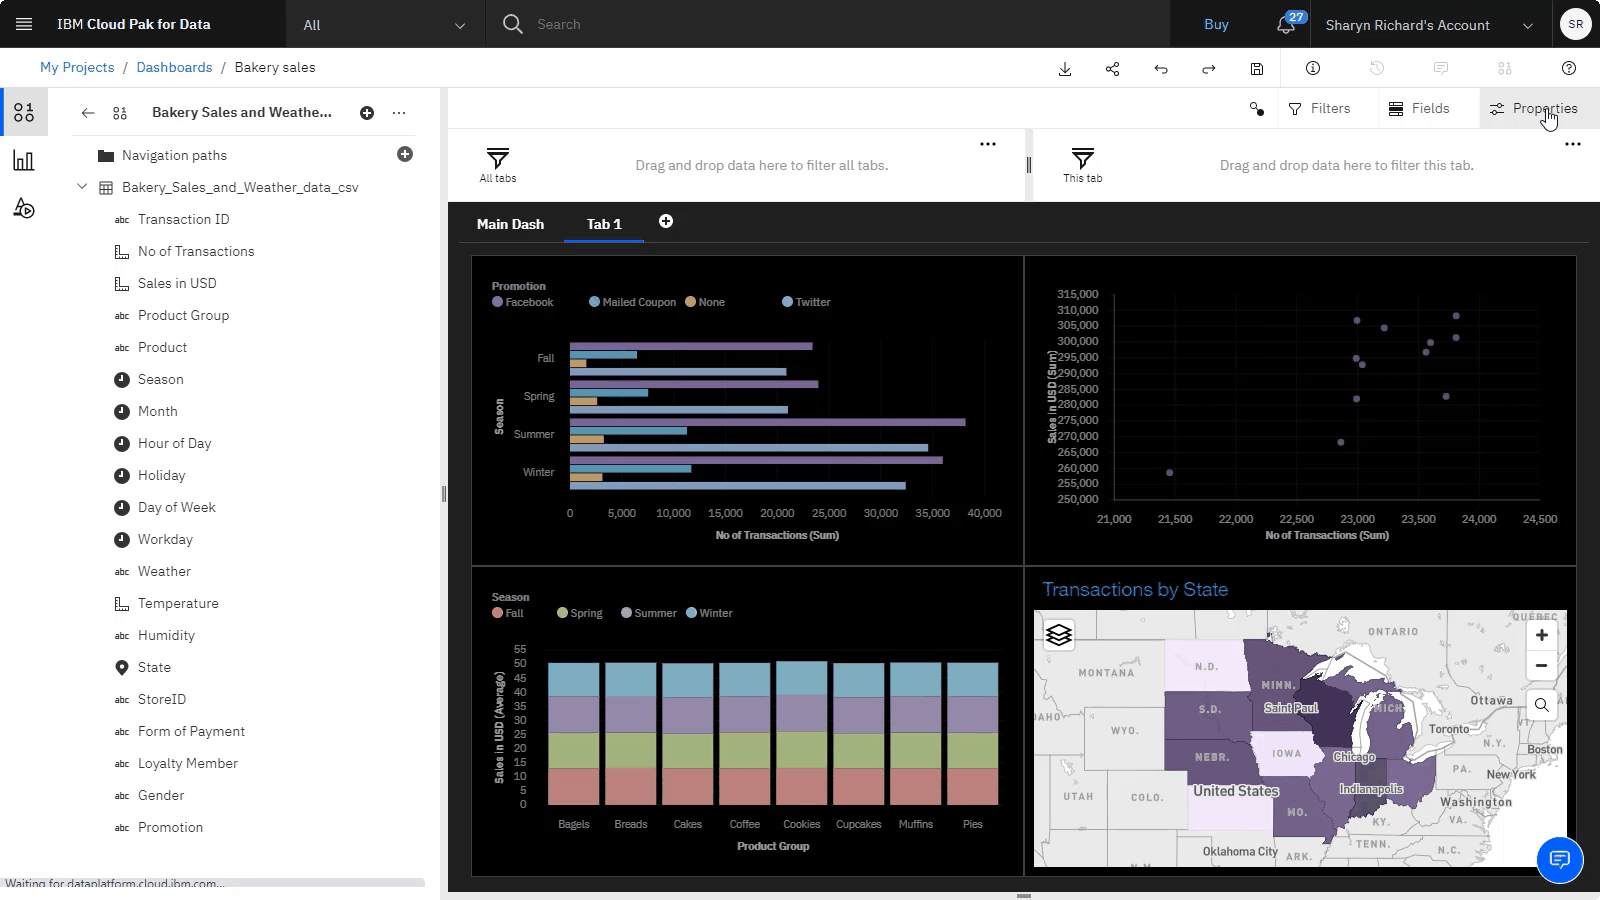
Chart 1: Create a bar chart that shows the number of transactions for each promotion by season.
-
Click the Visualizations icon to show the visualizations panel.
-
Drag the Bar icon to the middle of an empty section of the dashboard to create an empty bar chart. The Fields panel displays on the right.
-
Drag the following columns of data in
Bakery and weather data.csvto their respective fields in the Fields panel:-
Drag the Season column onto the Bars field.
-
Drag the No of Transactions column to the Length field.
-
Drag the Promotion column to the Color field.
-
-
-
Chart 2: Create a scatter chart that shows the number of transactions versus the dollar value in a given month.
-
Click the Visualizations icon to show the visualizations panel.
-
Drag the Scatter icon to the middle of an empty section of the dashboard to create an empty scatter chart. The Fields panel displays on the right.
-
Drag the following columns of data in
Bakery and weather data.csvto their respective fields:-
Drag the No of Transactions column to the x-axis field.
-
Drag the Sales in USD column to the y-axis field.
-
Drag the Month column to the Points field.
-
-
-
Chart 3: Create a stacked column chart to gain insight on how season affects the sale of product groups.
-
Click the Visualizations icon to show the visualizations panel.
-
Drag the Stacked column icon to the middle of an empty section of the dashboard to create an empty stacked column chart. The Fields panel displays on the right.
-
Drag the following columns of data in
Bakery and weather data.csvto their respective fields:-
Drag the Product group column to the Bars field.
-
Drag the Sales in USD column to the Length field.
-
Drag the Season column to the Color field.
-
-
Modify the stacked column chart to show the average number of sales for each season.
-
In the Fields panel, click the 3 dots next to Sales in USD.
-
In the context menu that opens, click Summarize > Average. You can also create your own calculation by clicking Calculation in the context menu instead.
-
-
-
Chart 4: Create a map that visualizes the number of transactions spatially by state.
-
Hold down Ctrl on your keyboard, and click No of Transactions and State to select them.
-
Drag the selected columns of data over into the middle of the last empty section on the dashboard. The dashboard service determines the best way to display the selected data. The Fields panel displays on the right.
-
Click Properties, and on the Visualization tab, customize the map appearance by removing the legend and disabling the automatic zoom.
-
In the Legend section, select the Show legend toggle to turn it off.
-
In the Chart section, select the Automatic zoom toggle to turn it off.
-
-
Click the General tab in the Visualization properties panel to add a title.
-
In the Appearance section, select the Show title toggle to turn it on.
-
Type the title you want to give your map.
-
-
-
You can modify the theme for the entire dashboard like the theme and background color.
-
Click a blank space anywhere in the dashboard pane to deselect the chart.
-
In the Dashboard properties panel, expand the Color and theme section, and select Dark in the Visual theme drop-down box.
-
 Check your progress
The following image shows the completed tab.
Task 6: Interact with visualizations in a dashboard
 To preview this task, watch the video beginning at 05:49.
Follow these steps to interact with all of the visualizations in each tab. All of the visualizations in a single tab are linked by default.
-
Click one of the data points on the scatter chart. The rest of the charts should change based on the point you selected.
-
Click the filter icon in the top right corner of any of the charts to see any filters that have been applied.
-
Click the remove icon for each filter you want to remove and clear all of the filters.
-
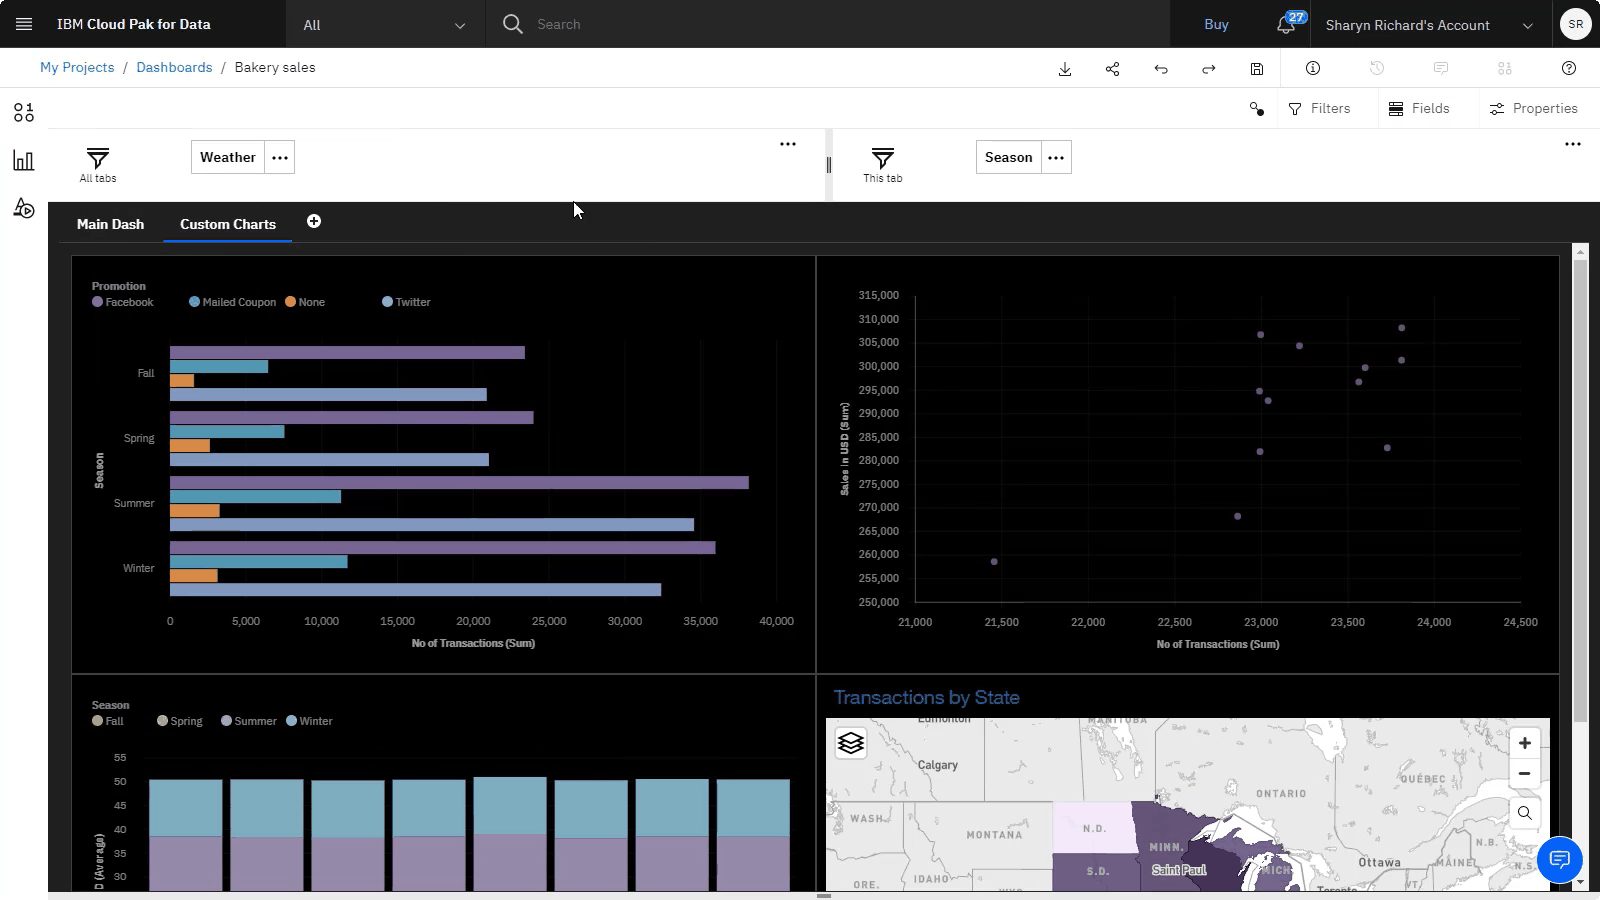
Create filters for users to interact with by dragging columns of data to the All tabs filter pane or the This tab filter pane.
-
Filters in the All tabs filter pane are available across all tabs.
-
Filters in the This tab filter pane are only available in current tab that you have selected.
-
Drag the Weather data to the All tabs filter pane.
-
Confirm the tab named Tab 1 is selected and drag the Season data to the This tab filter pane.
-
-
-
Double click Tab 1, and rename it to
Custom charts.
 Check your progress
The following image shows the finished dashboard.
Task 7: Share a dashboard
 To preview this task, watch the video beginning at 06:45.
Follow these steps to enable dashboard sharing to provide others with a link to the dashboard.
-
Click the Save icon to save the dashboard.
-
Click the Share icon.
-
In the window that opens, select the Share with anyone who has the link toggle to turn it on. This makes the dashboard publicly viewable to anyone who has the link.
-
Copy the link, and click Close.
-
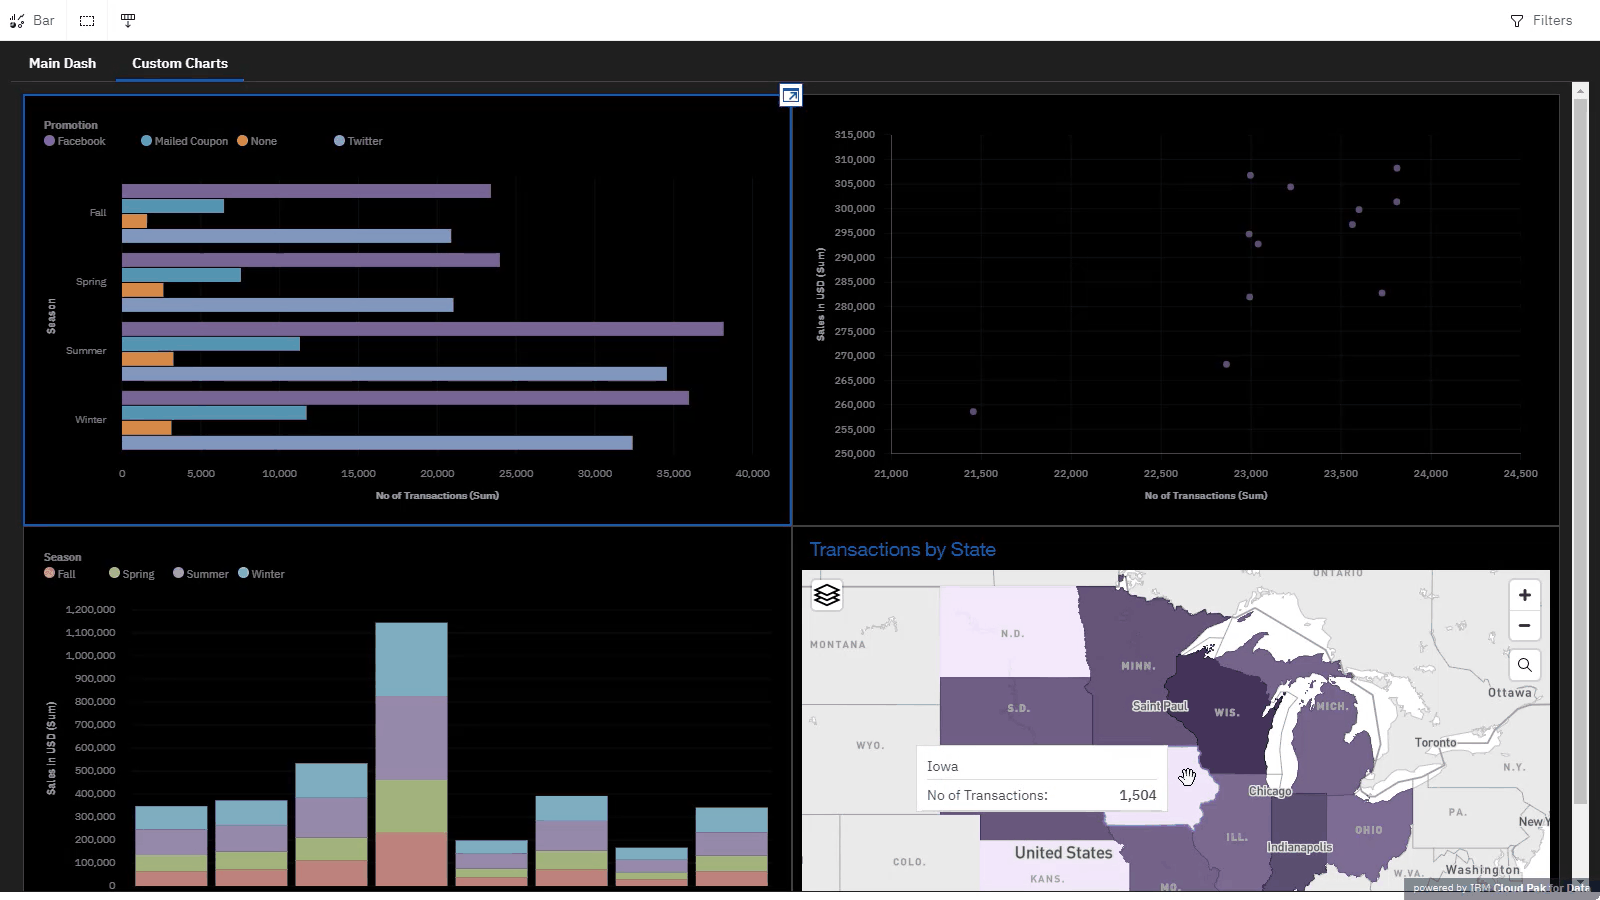
Paste the URL into the search bar of your browser to view and interact with the dashboard at that URL.
 Check your progress
The following image shows the shared dashboard.
Next steps
Now you can use this data set for further analysis. For example, you or other users can do any of these tasks:
Additional resources
- Find more videos.
- Try this additional tutorial to get more hands-on experience with dashboards: Create interactive dashboards on Watson Studio.
Parent topic: Quick start tutorials